The crypto market is mixed today with hues of both green and red visible. The assets were showing signs of weaknesses at the start of the week but a relief rally was visible yesterday with BTC touching the $31,000 mark again. Currently, the market is in consolidation facing stiff resistance at its breakout point.
The midweek gains were due to the introduction of a crypto assets bill which would answer a huge number of regulatory questions regarding the industry itself. The global market capitalization is around $1.24 Tr with a fall in volumes by about 6% in the last 24 hours.
Bitcoin and altcoins are losing optimistic momentum and chronic marketing at overhead resistance suggests that the present consolidation is way from over. Bitcoin (BTC) continues to change a spread with the native first-rate and bottoms coinciding with multiplied whale activity within the region, in line with on-chain analytics resource Whale Map.
The range-bound action in Bitcoin has unbroken the analyst’s idea and a few of them expect the consolidation to continue for a few additional times, whereas others anticipate another leg lower. The open interest for the June 10 alternatives expiry is $800 million however the real determination might decrease on account that bulls had been overly-positive.
These investors could have been fooled by means of the short-lived pump to $32,000 on May 31 due to the fact their bets for Friday’s alternatives expiry enlarged up to $50,000.
A report published on June 6 indicated that as of May 29, total realised losses by long-term holders accounted for more than 0.006% of the market cap. This compares to the peak of 0.015% of market cap reached during the 2018-2019 bear market. In addition to the size of the losses, investors may also have to be prepared for a longer period of subdued prices.
The duration of the current loss for long-term investors is only a month, while previous losses lasted about a year.
Ether (ETH) is down 25% in just a month, and even the recent upgrade to a Proof-of-Stake (PoS) consensus on the Ropsten test net failed to move the altcoin’s price. Overall, there was no significant change in the leverage positions of whales and market makers, although Ether failed to break the $1900 resistance on June 6th.
On one side it is likely that options traders are scared of a larger price correction of Eth happening but on the other hand futures traders have no desire to play a more bearish strategy.
Although analysts have been able to issue bullish price predictions, on the macroeconomic the threat of regulation continues to limit investor optimism, and a further blow came on June 2 when the US Commodity Futures Trading Commission (CFTC) filed a lawsuit against Gemini Trust Co over allegedly misleading statements in the Year 2017 to self-certification. Valuation of a bitcoin futures contract.
On June 7, a bill banning digital assets as a means of payment was introduced in the Russian Parliament. The draft law loosely defines digital financial assets as “electronic platforms” that must be recognized as subjects of the national payment system and submitted to the Central Bank Registry.
Technical Outlook:
BITCOIN:

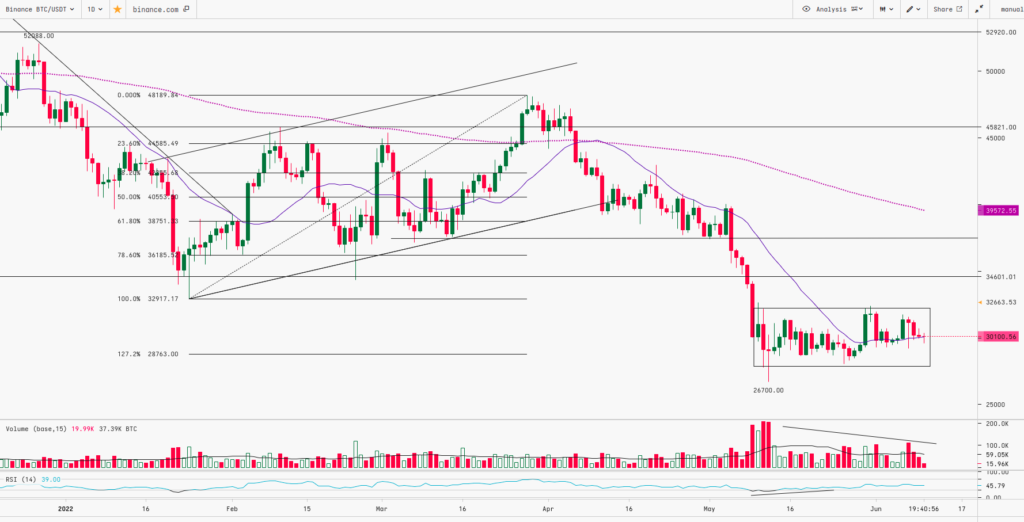
BITCOIN made a ‘Long Legged Doji’ candle at the low of $26,700. Post this, the asset continues to trade sideways in a range from $28,500 to $32,000 with low volumes. Currently, BTC is hovering around the psychological level of $30k and is trading just above its 20 Day Moving Average.
The RSI has given a positive divergence indicating that prices are losing their downward momentum and a trend reversal may soon follow. However, to witness a rally BTC needs to close and sustain above $32,500 whereas a break or a close below $28,500 will lead to further downfall.
ETH:

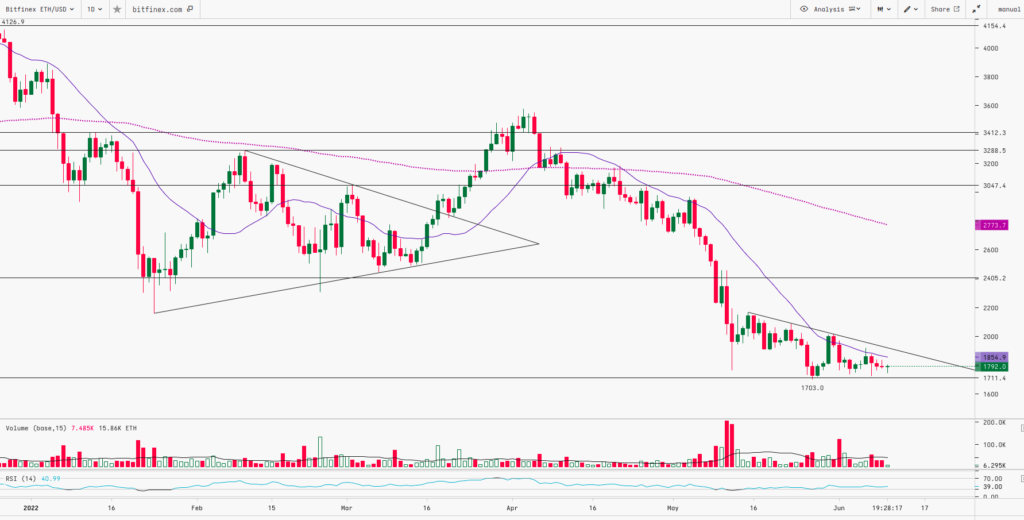
ETH after making the low of $1,703 is trying to take support at $1,700 (Previous low of ‘Double Bottom’ pattern) and its 200 Week Moving Average. However, it is facing stiff resistance at its 20 Day Moving Average. Technically, on a daily time frame, ETH is forming a ‘Descending Triangle’ pattern.
Once the breakout occurs above the triangle with good volumes then we can expect the upward movement. To witness a rally, the prices need to close and sustain above $2,150 whereas if it breaks and closes below $1,700 then the prices can further slide to $1,500 levels.
BAT:

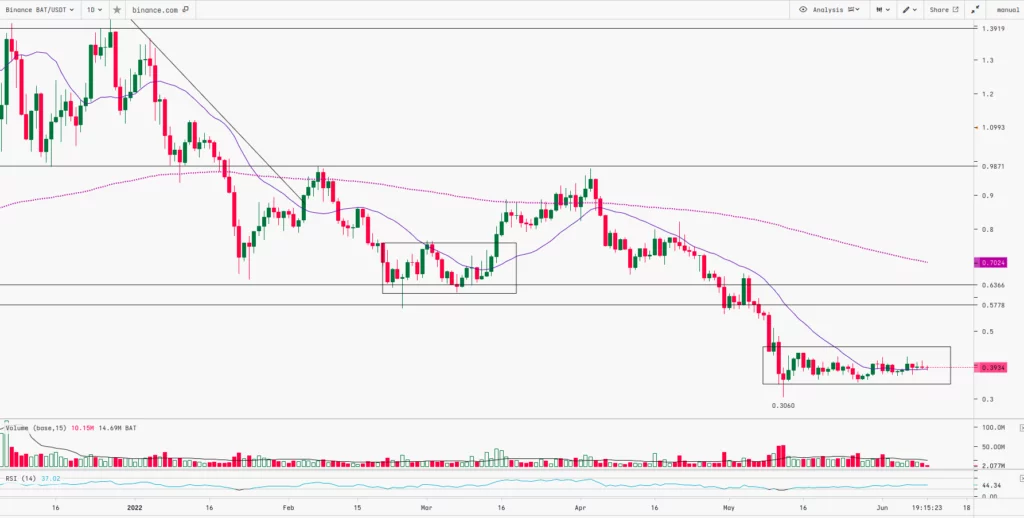
BAT continues to trade sideways in a rectangular pattern between $0.35 to $0.45 with declining volumes. On a daily time frame, the asset has made a series of small Doji candles that indicates indecision. Breakouts on either side of the range with good volumes will further decide the trend for the asset.
Weekly Snapshot:
| USD ($) | 02 Jun 22 | 09 Jun 22 | Previous Week | Current Week | |||
| Close | Close | % Change | High | Low | High | Low | |
| BTC | $30,467 | $30,112 | -1.17% | $32,250 | $28,327 | $31,693 | $29,312 |
| ETH | $1,834 | $1,790 | -2.43% | $2,005 | $1,721 | $1,915 | $1,729 |
| BAT | $0.40 | $0.39 | -1.55% | $0.42 | $0.3528 | $0.42 | $0.37 |
| Crypto asset | 1w – % Vol. Change (Global) |
| BitCoin (BTC) | -14.88% |
| Ethereum (ETH) | -17.64% |
| Basic Attention Token (BAT) | -19.09% |
| Resistance 2 | $37,000 | $2,150 | $0.85 | $0.60 |
|---|---|---|---|---|
| Resistance 1 | $32,000 | $1,950 | $0.70 | $0.45 |
| USD | BTC | ETH | MATIC | BAT |
| Support 1 | $28,800 | $1,700 | $0.50 | $0.35 |
| Support 2 | $25,000 | $1,500 | $0.35 | $0.30 |
Market Updates:
- LINK price broke its downtrend and rallied to $9 after the developers released a roadmap and announced that Chainlink 2.0 includes token staking.
- Leading crypto stablecoin Tether has announced the launch of a new asset, Tether (USDT) tokens, built on the Tezos blockchain, and with the ambition of expanding its digital footprint across the digital payments and decentralised finance (DeFi) sector.
- Financial and technical information platform Bloomberg has vastly expanded its coverage of crypto markets after a decision to include data on the top 50 crypto assets in the Bloomberg Terminal.
- The Binance CEO mentioned that the exchange is looking to obtain the virtual assets service provider (VASP) licence, which allows the platform to legally facilitate the exchange of digital assets and the conversion of crypto to the Philippine peso.
*Sources of charts: https://cryptowat.ch, https://pro.zebpay.com/trade/USDT-INR
Disclaimer: This report is not intended to be relied upon as advice to investors or potential investors and does not take into account the investment objectives, financial situation, or needs of any investor. All investors should consider such factors in consultation with a professional advisor of their choosing when deciding if an investment is appropriate. The Company has prepared this report based on information available to it, including information derived from public sources that have not been independently verified. No representation or warranty, express or implied, is provided in relation to the fairness, accuracy, correctness, completeness, or reliability of the information, opinions, or conclusions expressed herein. This report is preliminary and subject to change; the Company undertakes no obligation to update or revise the reports to reflect events or circumstances that arise after the date made or to reflect the occurrence of unanticipated events. Trading & Investments in crypto assets viz. Bitcoin, Bitcoin Cash, Ethereum, etc are very speculative and are subject to market risks. The analysis by the Author is for informational purposes only and should not be treated as investment advice.

