
Bitcoin dipped below $95,500 on Feb. 23 after struggling to break past the $100,000 mark on Feb. 21. The longer it remains below this key level, the higher the likelihood of a decline toward the critical $90,000 support. Analysts remain divided on Bitcoin’s next move—some anticipate a fresh all-time high as early as next month, while others predict a pullback to $85,000 before the uptrend resumes. The rejection at the 50-day simple moving average ($98,933) on Feb. 21 suggests strong resistance from the bears at this level.
At the time of writing, BTC was trading at $95,515.
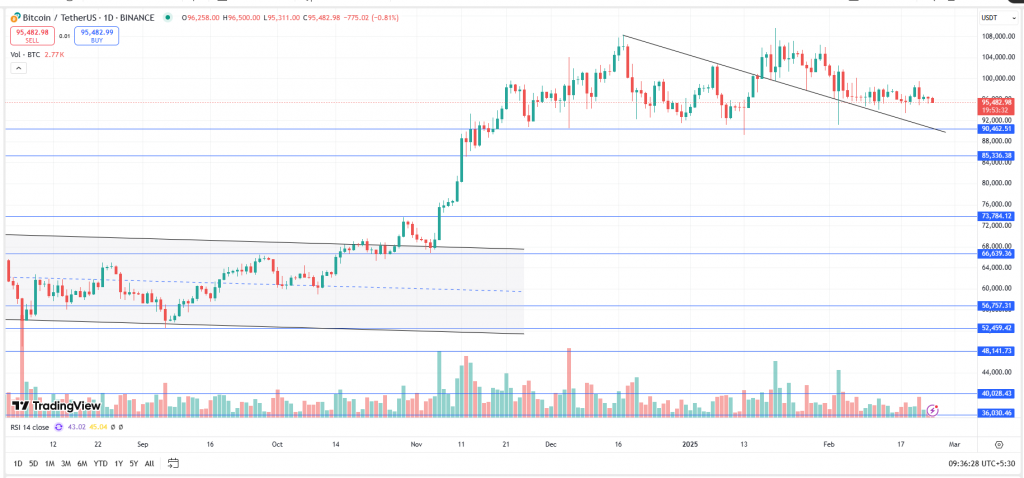
On the daily time frame, BTC continues to trade within a narrow range of $94,000 to $100,000 over the past three weeks, with declining volumes. On the broader weekly time frame, the asset has formed a ‘Spinning Top’ candle and a ‘Long-Legged Doji’ candle, indicating indecision in the trend. The asset has repeatedly found support at $90,000, while $110,000 is expected to act as strong resistance. A breakout on either side of these levels, accompanied by significant volume, will further determine BTC’s trend.
Key Levels:
| Support 2 | Support 1 | Asset | Resistance 1 | Resistance 2. |
| $85,000 | $90,000 | BTC | $110,000 | $125,000 |
In the grand scheme of things, ZebPay blogs are here to provide you with crypto wisdom—get started today and join 6 million+ registered users to explore endless features on ZebPay!