
Bitcoin’s price is showing increasing signs of vulnerability as it approaches the weekly close, raising the risk of a potential drop to $75,000. Exchange order books indicate a critical zone of interest for traders, with liquidation levels on both sides of the spot price appearing susceptible. As BTC/USD slipped to $83,000, long positions began to incur losses. Meanwhile, Bitcoin exchange-traded funds (ETFs) witnessed net outflows of nearly $370 million on March 7, following news of President Donald Trump’s proposal for a U.S. strategic Bitcoin reserve. This development suggests growing caution among investors.
At the time of writing, BTC was trading at $81,950.
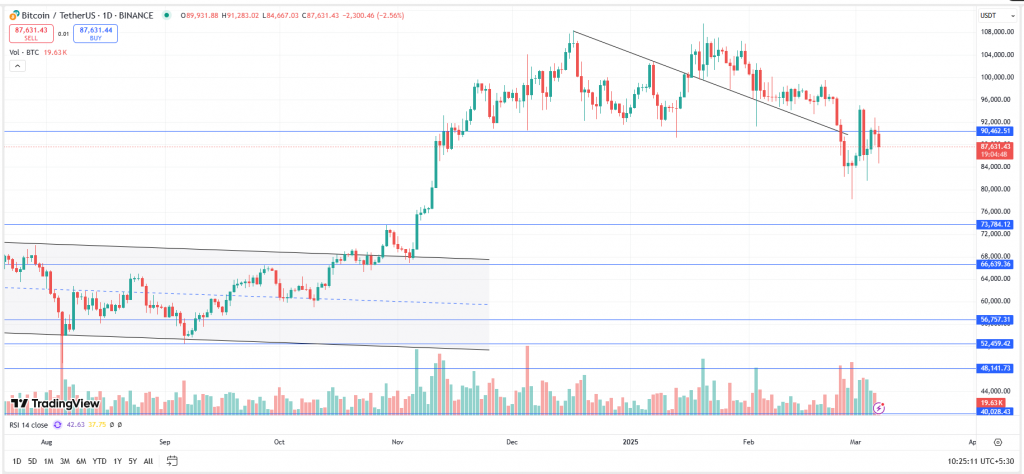
BTC, after making an all-time high of $109,588, started trading in a ‘Descending Triangle’ pattern and was taking strong support at $90,000. The asset eventually broke below the pattern, causing prices to drop to $78,258. BTC formed a ‘Hammer’ candle at the recent low and staged a relief rally up to $95,000. However, the bulls lost their grip, leading to a correction to $80,000. Currently, the asset is attempting to hold support at this level. If it sustains above $80,000, the bulls may regain momentum. If it closes below $80,000, prices could slide further to $73,500.
Key Levels:
| Support 2 | Support 1 | Asset | Resistance 1 | Resistance 2. |
| $73,500 | $80,000 | BTC | $95,000 | $110,000 |
Keep yourself ahead of the crypto curve with ZebPay blogs—click the button below and join 6 million+ users who trust ZebPay for their trading needs!