Here is a technical analysis of ETH/USDT on a daily timeframe:
Chart Technical Analysis
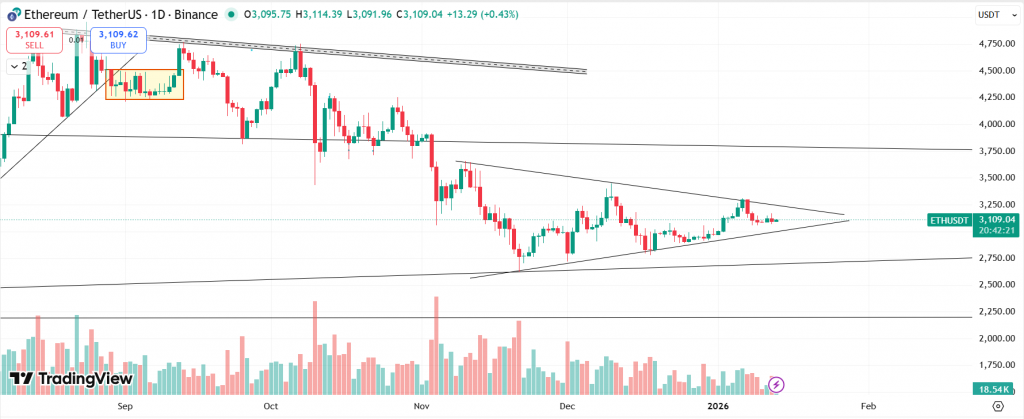
Current Price: $3,110 (ETH/USDT)
Ethereum is trading near 3,100 USDT after a prolonged decline from the 4,700–4,800 region. Overall, the market is not bullish yet, but selling pressure has clearly slowed. The price is now moving sideways, which often occurs before a strong move.
Pattern Analysis
The chart shows a symmetrical triangle pattern, indicating that price is being squeezed between higher lows and lower highs. Buyers are gradually stepping in, while sellers continue to defend higher levels. This pattern typically leads to a significant move, although the direction is not yet confirmed.
Also Read: ZebPay Introduces SIP Feature to Simplify Long-Term Bitcoin Investing
Market Structure
From a broader perspective, ETH is still forming lower highs, suggesting that the long-term trend remains weak. A major downward resistance trendline is still active above the price, indicating continued seller presence. However, ETH is no longer declining sharply, which suggests that panic selling has eased for now.
Key Support & Resistance Levels
Strong Support: 2,750–2,800 (buyers previously stepped in here)
Near Support: Around 3,000 (important psychological level)
Immediate Resistance: 3,250–3,300 (triangle resistance)
Major Resistance: 3,750–3,800 (previous breakdown zone)
Also Read: Bitcoin Technical Analysis Report – 12th January 2026
Volume
Trading volume is decreasing, which is normal during a triangle formation. A genuine breakout should be accompanied by strong volume, as low-volume breakouts often fail.
ETH is at a critical point, and this is not the time to anticipate direction. A prudent approach is to wait for a clear breakout or breakdown supported by volume and then trade accordingly.
At the time of writing, ETH was trading at $3,110.
Summary
ETH/USDT is at a key decision zone. The symmetrical triangle suggests an upcoming expansion in volatility. Traders should avoid predicting direction and instead wait for confirmation through a breakout with volume. Until then, the market remains neutral, with equal probability of upside or downside movement.
Key Levels
| Support 2 | Support 1 | Asset | Resistance 1 | Resistance 2 |
| $2,800 | $3000 | ETH | $3,300 | $3,400 |
In the grand scheme of things, ZebPay blogs are here to provide you with crypto wisdom. Get started today and join 6 million+ registered users to explore endless features on ZebPay!