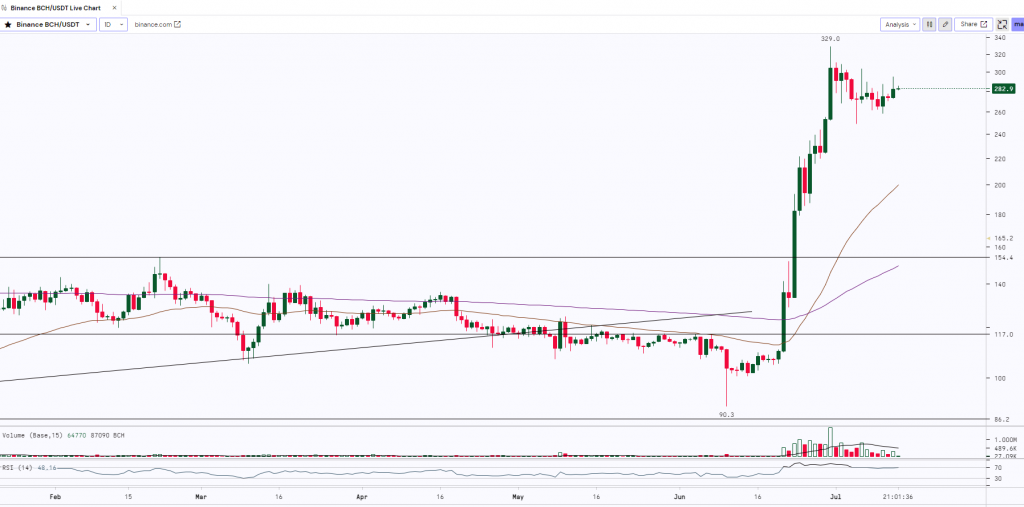
On June 30th, the price of Bitcoin Cash (BCH) reached a new high for the year, continuing its impressive rally that began on June 10th. The price of BCH has surged by an impressive 200% during this period without undergoing any significant retracements. However, when considering wave count analysis, there is a possibility of a temporary decline in the near future before the price resumes its upward movement. Despite this potential decline, the weekly Relative Strength Index (RSI) indicates support for the continuation of the overall price increase. As of now, BCH is trading flat and has not seen much movement over the past week.
At the time of writing, BCH was trading at $283.2.

BCH witnessed a massive rally and the prices surged almost by 263% from $90.3 to $329 within just twenty days. The bulls, however, struggled to sustain the prices above $300 and the asset saw some profit bookings and the prices dropped to $249.8. Post this move, BCH is trying to make a ‘Bullish Flag’ pattern and has been trading sideways in a broad range from $250 to $300 with declining volumes. Breakouts on either side of the range with good volumes will further decide the trend for the asset.
Key Levels
| Support 2 | Support 1 | Asset | Resistance 1 | Resistance 2 |
| $217 | $250 | BCH | $300 | $330 |


