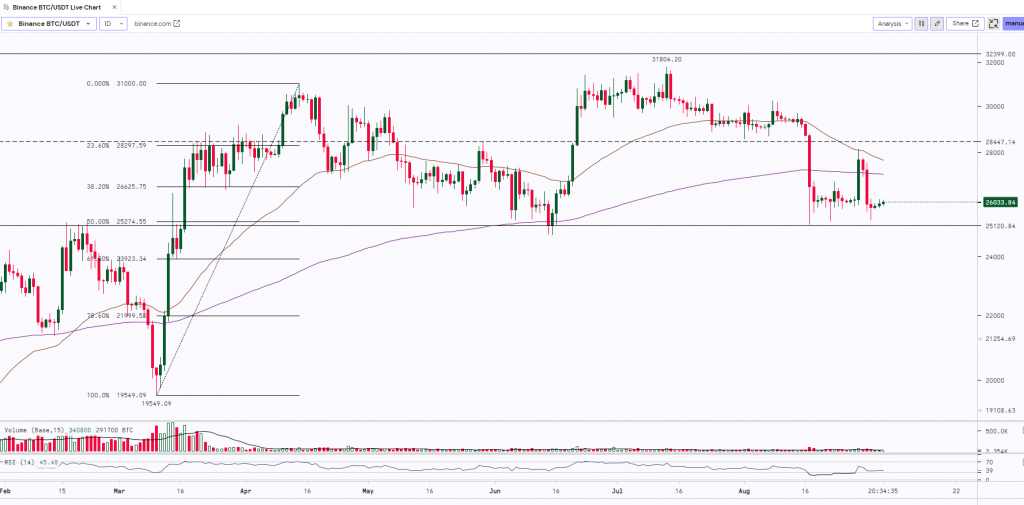
Bitcoin’s recent price movement has been characterised by a lack of clear direction. The price of Bitcoin remained below $26,000 at the close of the week on September 3rd, despite some overly pessimistic sentiment among traders. Over the weekend, Bitcoin exhibited low volatility, trading within a narrow range of about $200. This lack of clear direction may feel familiar to market participants, as it resembles the behaviour observed during the August monthly close. Last week’s events, including developments involving crypto asset manager Grayscale and regulatory actions in the United States, have not left a significant impact on Bitcoin’s charts. As a result, traders are carefully considering various potential scenarios for the weekly close.
At the time of writing BTC was trading at $26,030.

Bitcoin after testing the crucial support level of $25,000 ( Horizontal Trendline & 50% Fibonacci Retracement Level) started to consolidate and was trading sideways in a narrow range from $26,500 to $25,800. The asset broke above the range and rallied up to $28,142. However, the bulls failed to manage their grip on the asset as the prices did not sustain above $28k and the 50-day Moving Average. The asset witnessed a sharp correction and dropped to $25,333. BTC has a very strong support at $25,000. If it holds and sustains above the support then we can expect the bulls to resume the up move whereas a fall below this level will lead to further downfall.
Key Levels:
| Support 2 | Support 1 | Asset | Resistance 1 | Resistance 2. |
| $22,000 | $25,000 | BTC | $28,500 | $32,500 |


