
Bitcoin’s price has slipped from its intra-week high of approximately $72,000, but the bulls strive to maintain support above $67,000. The crypto is poised to close the week with modest gains of just over 2%. Despite not breaking through the overhead resistance, buying interest has remained steady. Investor data reveals around $1.7 billion in inflows into spot Bitcoin exchange-traded funds (ETFs) this week, pushing the total investment to $15.5 billion as of June 6th. This strong buying activity indicates that traders expect the upward trend to persist.
At the time of writing, BTC was trading at $69,674.
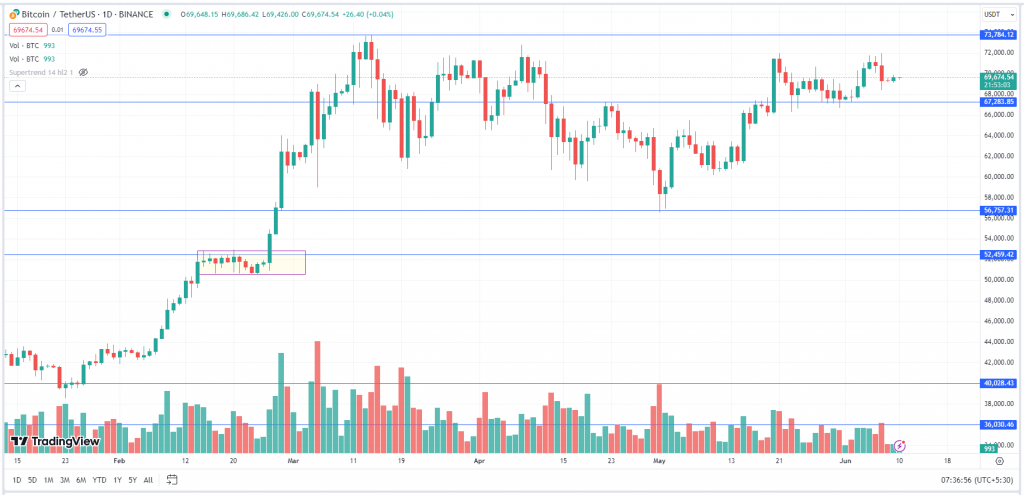
After correcting almost by 23%, Bitcoin dropped from its all-time high of $73,777 to $56,552. The lower shadow around the crucial support level of $56,000 indicated buying from these levels and the prices rallied up to $71,979. BTC is struggling to sustain and give a weekly close above $70,000 and continues to trade in a broad range between $72,000 to $67,000 with declining volumes. Breakouts on either side of the range will further decide the trend for the asset.
Key Levels:
| Support 2 | Support 1 | Asset | Resistance 1 | Resistance 2. |
| $60,000 | $67,000 | BTC | $73,777 | $85,000 |