
Bitcoin’s price has remained within a well-established range, with the latest close around $26,500 on September 24th. Exchange traders continue to accumulate Bitcoin, but the bulls have struggled to initiate a significant upward move. This suggests that there might be limited demand at higher price levels. Despite macroeconomic volatility and catalysts from the United States, Bitcoin has maintained its price stability, providing a relatively calm ending to the Wall Street trading week. It’s important to monitor Bitcoin’s price dynamics and market developments to gain insights into its future movements.
At the time of writing BTC was trading at $26,161
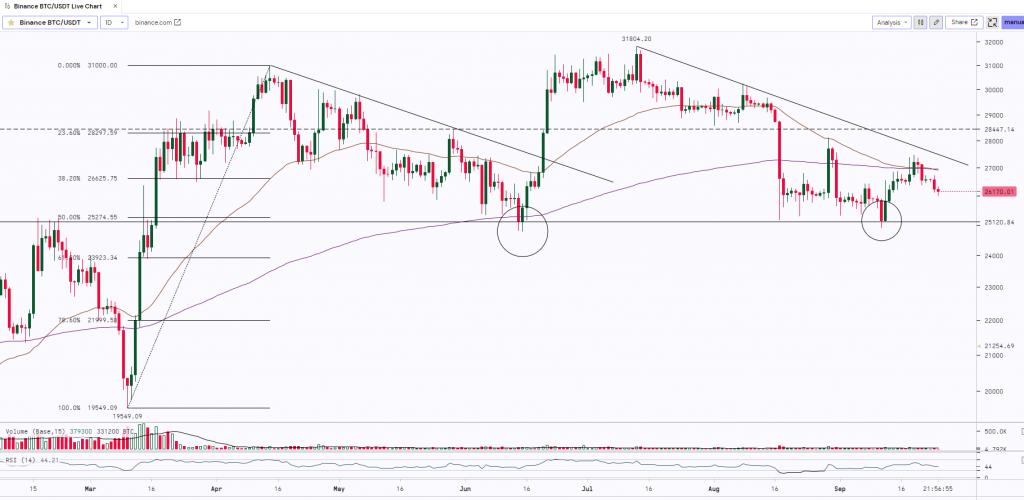
BTC is trying to take support at the crucial level of $25,000 (Horizontal Trendline & 50% Fibonacci Retracement Level). The lower shadow and the big green body candle indicates buying near the psychological support level but with low volumes. $28,500 and $32,500 will act as a major hurdle for the bulls and to witness a rally it needs to break, close and sustain above $32,500 whereas a break below the support $25k will lead to further downfall.
Key Levels:
| Support 2 | Support 1 | Asset | Resistance 1 | Resistance 2. |
| $22,000 | $25,000 | BTC | $28,500 | $32,500 |