
The price has been struggling under heavy selling pressure and is on track for a weekly decline of over 9%. Bitcoin has consistently formed lower highs over the past few months, signalling a bearish trend. This puts the burden on the bulls to defend key support levels.
Meanwhile, markets are anticipating a major catalyst with a potential rate cut by the U.S. Federal Reserve in September.
At the time of writing BTC was trading at $57,702.
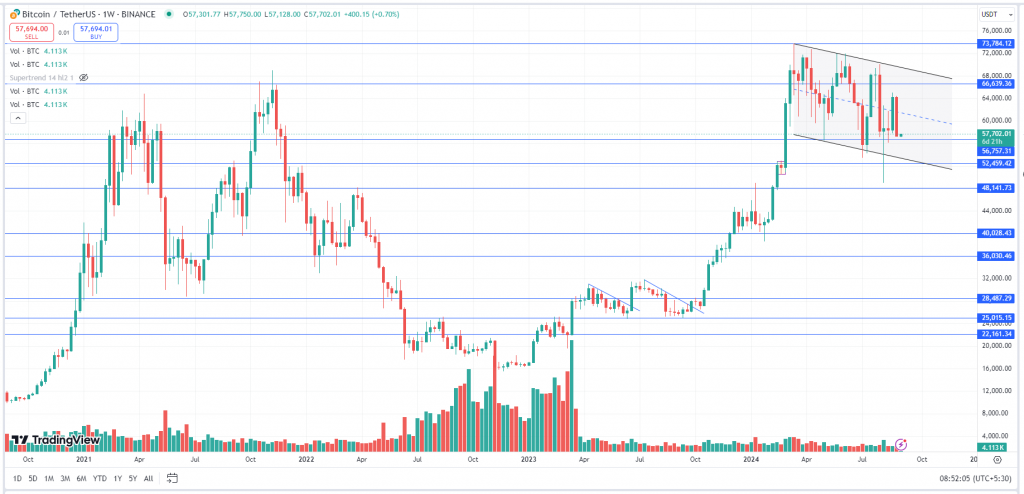
BITCOIN, over the past three weeks continues to trade sideways in a broad range from $56,000 to $65,000 with low volumes. On the weekly chart, we can see that the asset is trying to make a ‘Bullish Flag’ pattern. BTC has also struggled to sustain and give a weekly closing above the $70k mark. To witness a rally, it needs to give a breakout above the pattern with good volumes and the prices have to sustain above $70,000. The asset has a strong resistance at $66,500 whereas $56,000 and $52,500 will act as a strong support.
Key Levels:
| Support 1 | Support 2 | Asset | Resistance 1 | Resistance 2 |
|---|---|---|---|---|
| $52,500 | $56,000 | BTC | $66,500 | $73,777 |
Keep yourself ahead of the crypto curve with ZebPay blogs. Click on the button below and see why millions trust ZebPay with their trading needs!