
As the fourth quarter of 2023 begins, the outlook for the crypto market seems uncertain. The recent performance of Bitcoin and other crypto assets has been less than promising. This decline was prompted by the release of important inflation data, dampening the positive sentiment that followed a favourable court ruling earlier this week. September has historically been a challenging month for Bitcoin, which has raised concerns among traders. During Asian afternoon trade, both BTC and Ether experienced declines, mirroring the trend seen in the other top 10 crypto assets. The exception was Dogecoin, which managed to register gains. The value of crypto assets had seen an increase on the previous day due to a favourable legal outcome for Grayscale Investments in its ongoing battle with the Securities and Exchange Commission (SEC).
Bitcoin’s price experienced a minor drop of less than 1% in the last 24 hours, settling at $27,250. This followed a slight uptick of around $50 after the release of US inflation data. The leading digital asset had previously retreated from its recent peak of over $28,000 reached on Tuesday, which occurred after a US court ruling that favoured the Securities and Exchange Commission, potentially opening the path for a spot Bitcoin exchange-traded fund.
The current trajectory of BTC’s price is heavily influenced by the 200-day moving average as the monthly closing approaches, leading to differing opinions on its future direction. BTC has managed to maintain its gains throughout the week, prompting certain traders to reinforce their optimistic BTC price predictions. Although Bitcoin retraced from its recent highs above $28,000, a complete reversal of this move has not yet been instigated by the bears. This situation has garnered positivity among some market participants, as BTC/USD has successfully retained a long-term trend line that was lost as support earlier in August. This trend line aligns with the 200-day exponential moving average (EMA), which is presently positioned at $27,180. Despite some hourly candle closures falling below this average by the end of August 31, these instances haven’t triggered a substantial breakdown. Instead, Bitcoin has remained closely aligned with the 200-day EMA as the month draws to a close. Looking ahead, the next halving event for Bitcoin is scheduled for April 2024. This event is anticipated to reduce the issuance of new Bitcoins by half, consequently increasing scarcity and potentially driving up prices.
Ether once again found support at the critical level of $1,626 on August 28, demonstrating that the bulls are actively buying during price dips. This buying momentum gained traction on August 29, propelling the price above the 20-day exponential moving average ($1,716). This suggests that the ETH/USDT trading pair might continue fluctuating between $1,626 and $1,816 for a while. However, on August 30, the price retraced below the 20-day EMA, indicating that the bears are still actively engaged. Despite Ethereum’s price experiencing a prolonged decline, a fundamental metric for the network is showing positive performance. Approximately 28 million ETH tokens are currently staked. Additionally, the supply of Ethereum (ETH) available on crypto exchanges has declined. In January, over 13 million ETH were held on exchanges, but this number has now reduced to 10.7 million.
On the macro front, Bitcoin’s performance has lagged behind traditional stock market indices like the Dow Jones Industrial Average and the S&P 500, marking a period of notable tranquillity in the crypto space. The core PCE figure showed a 4.2% year-on-year growth in July, a slight increase from June’s 4.1%, aligning closely with expert forecasts. Economic indicators remain crucial for assets sensitive to market risk, as investors adjust their expectations regarding the trajectory of interest rates. Since March 2022, the Federal Reserve has embarked on a notable tightening of interest rates, reaching levels not seen in generations, impacting both Bitcoin and traditional equities. This policy has been driven by the aim of managing inflation. Any signs of economic deceleration might lead the Federal Reserve to pause its rate hikes and even consider the possibility of reducing borrowing costs sooner, making the upcoming August jobs report on Friday a focal point after the release of Thursday’s inflation report.
Technical Outlook:
BITCOIN:
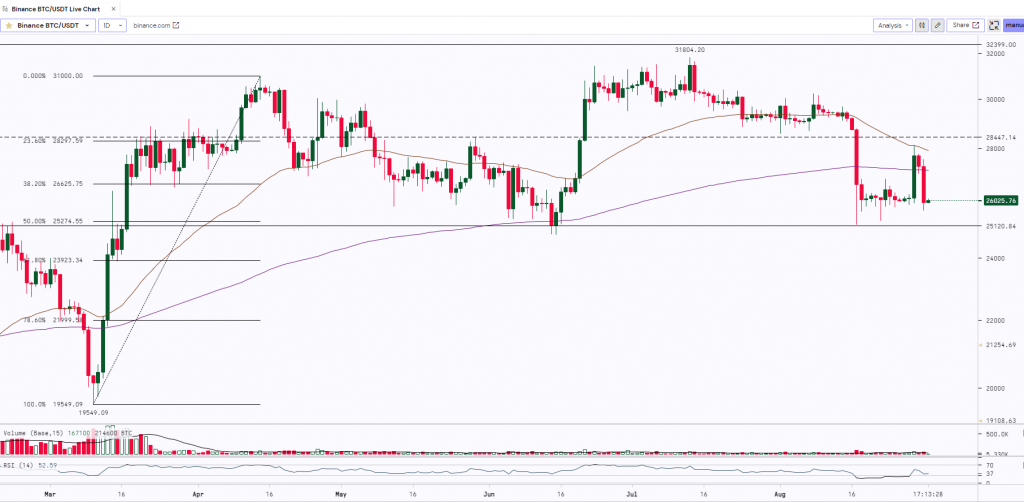
Bitcoin after testing the crucial support level of $25,000 ( Horizontal Trendline & 50% Fibonacci Retracement Level) started to consolidate and was trading sideways in a narrow range from $26,500 to $25800. The asset gave a breakout above the range and rallied up to $28,142. However, the bulls failed to manage their grip on the asset as the prices did not sustain above $28k and the 50 Day Moving Average and witnessed a sharp correction. BTC has a very strong support at $25,000, If it holds and sustains above the support then we can expect the bulls to resume the up move whereas a fall below this level will lead to further downfall.
ETH:
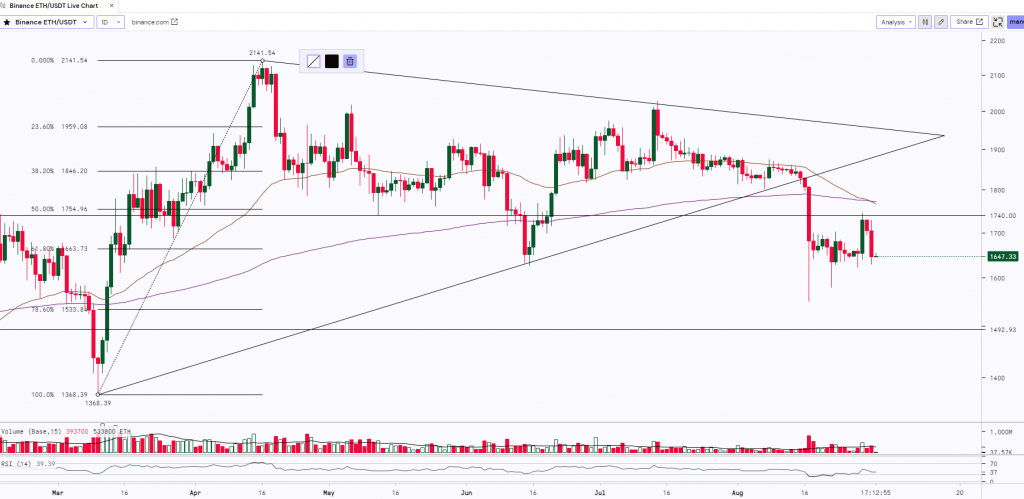
ETH after surging 49% from $1,368 to $2,041 started trading in a broad range making a ‘Symmetrical Triangle’ pattern where the lower uptrend line was acting as a support and the upper downtrend line was acting as a resistance. ETH finally gave a breakout on the downside of the range and the prices reached a low of $1,550 and started consolidating between $1,700 to $1,625. ETH did break the range on the upside and rallied up to $1,745. However, it failed to breach the resistance level of $1,750 (Horizontal Trendline), and the prices dropped to $1,630. ETH has a strong support zone from $1,535 to $1,500 (Horizontal Trendline & 78.6% Fibonacci Retracement Level).
BNB:
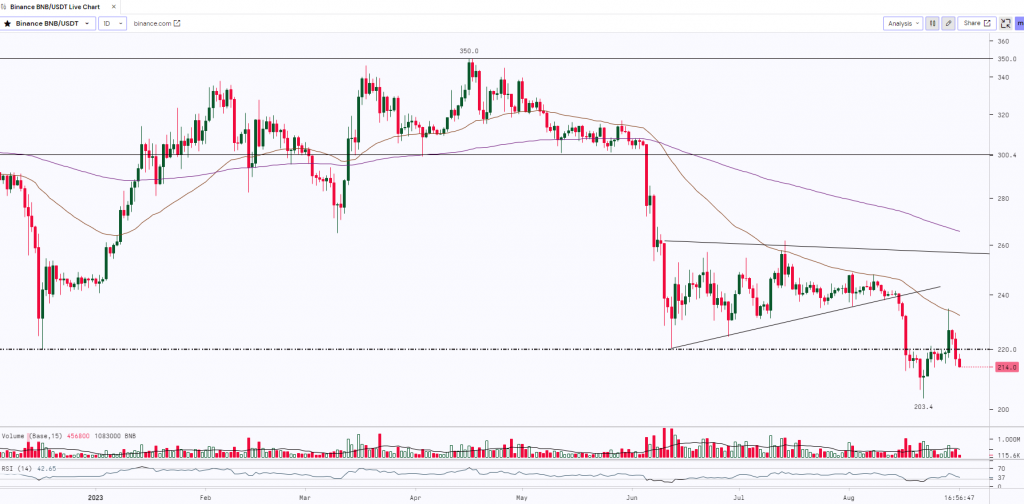
BNB made a ‘Tweezer Top’ candle at the high of $350 and witnessed a sharp correction. The prices plunged almost by 37% and made a low of $220. The asset was taking good support at $220 and started trading in an ‘Ascending Triangle’ pattern. BNB finally broke the pattern on the downside and saw another correction. It also broke the long-held support of $220 and made a low of $203. BNB has made a ‘Morning Star’ pattern at the low and rallied up to $234.8. The asset faced stiff resistance at its 50-day Moving Average and the prices dropped to $213. BNB has a strong support of $200 whereas $220 will act as a strong resistance.
Monthly Snapshot
| July | August | Last Month | Current Month | ||||
| Close | Close | % Change | High | Low | High | Low | |
| BTC | $29,199 | $26,194 | -10.29% | $31,815 | $28,934 | $30,177 | $25,409 |
| ETH | $1,860 | $1,656 | -11.00% | $2,026 | $1,828 | $1,878 | $1,552 |
| MATIC | $240.50 | $217.34 | -9.63% | $261.10 | $230.59 | $248.51 | $204.40 |
| crypto | 1m – % Vol. Change (Global) |
| BitCoin (BTC) | 5.75% |
| Ethereum (ETH) | -13.64% |
| Binance Coin (BNB) | -12.41% |
| Resistance 2 | $37,250 | $2,150 | $0.95 | $285 |
|---|---|---|---|---|
| Resistance 1 | $32,500 | $2,000 | $0.75 | $255 |
| USD | BTC | ETH | Matic | BNB |
| Support 1 | $28,500 | $1,750 | $0.50 | $220 |
| Support 2 | $25,000 | $1,600 | $0.41 | $200 |
Market Updates:
- Human ID project Worldcoin signed up over 9,500 users in Argentina in a single day in August, setting a record for single-day sign-ups.
- The pre-sale of an Ethereum (ETH) -based smartphone turned out to be a great success. Within 24 hours, the first 50 mobile devices with an operating system based on a network of smart contracts were sold out.
- The EOS token has been granted whitelist approval by Japan’s crypto regulator, paving the way for the token to be traded against the Japanese yen on regulated exchanges in the country.
- The United States Securities and Exchange Commission (SEC) has postponed its decision on WisdomTree’s Bitcoin Trust to 17th October which was first filed on Dec 8 2021. The institutional giant refiled its ETF application on July 19, 2023, with the first deadline approaching.