The crypto market has experienced a decline this week, with the total market capitalization dropping by 4.4% to its lowest level since June 14, reaching $1.02 trillion. This decline has led to an increase in Bitcoin’s market dominance, as regulatory uncertainties cast a shadow over the altcoin markets. Although there has been significant anticipation around recently filed Ether and Bitcoin exchange-traded funds (ETFs), the United States Securities and Exchange Commission (SEC) has continued to postpone decisions regarding these financial instruments. This regulatory uncertainty has contributed to the market’s overall bearish sentiment. One significant factor is the prevailing bearish sentiment in the crypto market, reflected in metrics like the Crypto Fear and Greed Index, which is currently in the “Fear” zone. This suggests that market participants are cautious and uncertain.
The Bitcoin (BTC) price appears to be moving in the opposite direction of the US Dollar Index (DXY). There’s a potential “death cross” forming in Bitcoin’s price chart, where its 50-day simple moving average (SMA) is about to drop below its 200-day SMA. This pattern, if confirmed, typically indicates short-term momentum underperforming long-term momentum, which can signal a bearish trend. It’s worth noting that Bitcoin and other risk assets, like tech stocks, often have an inverse correlation with the US Dollar Index. Conversely, the US Dollar Index is poised to confirm a “golden cross,” which is the opposite of a death cross. A golden cross suggests that short-term momentum is outperforming long-term momentum and can indicate a bullish trend. The US Dollar Index has been on the rise, gaining 5.3% since mid-July and reaching its highest point since March 15. This inverse correlation between Bitcoin and the US Dollar Index highlights the complex interplay between cryptocurrencies and traditional financial markets. Traders and investors often monitor these relationships to gain insights into potential market movements.
Ethereum (ETH) has experienced a notable decline in its price and on-chain metrics since its peak above $2,100 earlier in 2023. The crypto is currently trading 24% below this high, hovering around $1,600. Several factors suggest that ETH may face further downward pressure. Additionally, on-chain metrics indicate a decrease in demand for Ethereum. The total value locked (TVL) in Ethereum has fallen from its 2023 peak of $31.5 billion in April to its current value of $21.46 billion, as reported by DeFiLlama. A decrease in TVL suggests reduced activity in decentralized finance (DeFi) and other Ethereum-based applications. These factors, combined with the overall bearish sentiment in the market, raise concerns that Ethereum’s price could drop below the $1,600 level. Traders and investors are closely monitoring these developments to assess the crypto’s future trajectory. The beginning of September saw a surge in Ethereum leveraged liquidations, resulting in approximately $37 million worth of liquidations during the first week of the month.
On the macro front, The U.S. dollar holds a unique position in the global economy as the primary reserve currency, dominating international trade, non-bank lending, and global debt transactions, as stated by the International Monetary Fund (IMF). Consequently, any significant strengthening of the U.S. dollar can lead to financial tightening on a global scale, exerting downward pressure on risk assets.
Recent developments in the foreign exchange (FX) market have been influenced by rising energy prices. The U.S., which is energy independent and a net exporter of energy, is well-suited to benefit from higher energy prices. Therefore, the U.S. dollar appears poised to benefit from these conditions. The primary challenge to the U.S. dollar in the near future would likely come from a significant reassessment of economic growth prospects. Currently, with the U.S. economy performing well, there is growing skepticism in the markets regarding the expectation of rapid interest rate cuts by the Federal Reserve (Fed) in the coming year.
Technical Outlook:
Bitcoin:
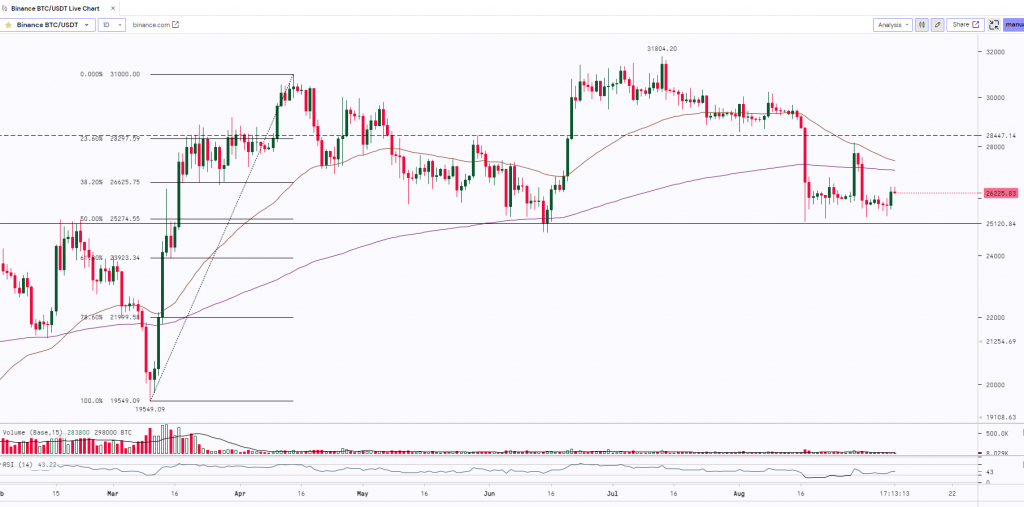
BITCOIN continues to trade sideways in a range from $25,500 to $26,500 with low volumes. The bulls are defending the crucial support level of $25,000 ( Horizontal Trendline & 50% fibonacci retracement Level). If it holds and sustains above the support then we may expect the bulls to resume the up move. However, $32,500 will be the major hurdle for bulls and to witness a rally BTC needs to break, close and sustain above the resistance level of $32,500.
Ethereum:
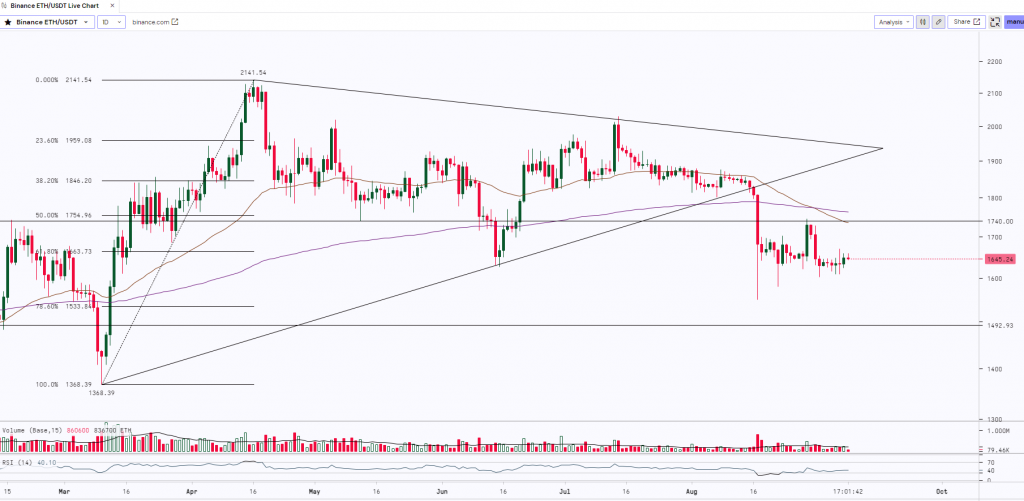
ETH too has been trading sideways in a range from $1,600 to $1,650 over the last week. The asset is making small ‘Doji’ and ‘Spinning top’ candles indicating indecision in trend. The asset has a strong support zone from $1,535 to $1,500 whereas $1,750 to $1,775 will act as a strong resistance zone and breakouts on either side of the levels with good volumes will further decide the trend for the asset.
BNB:
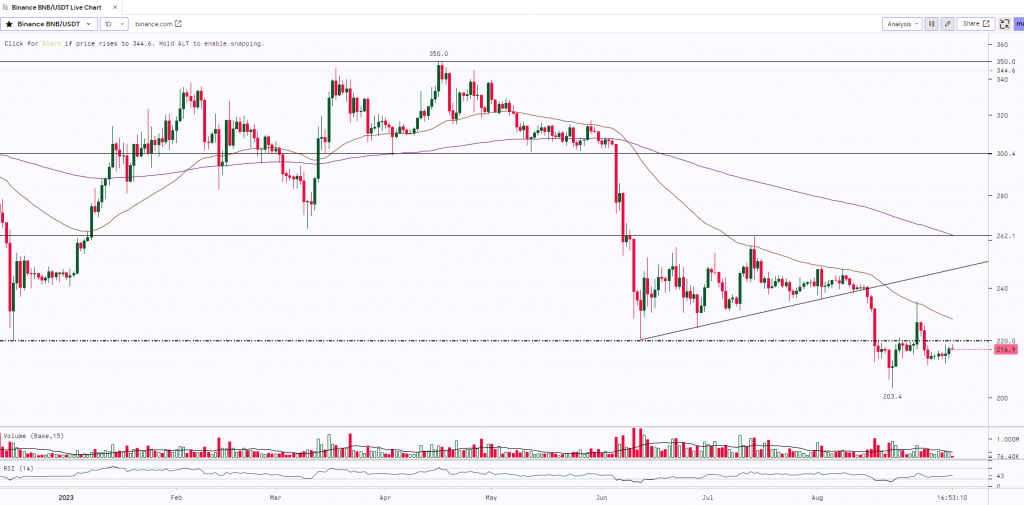
BNB made a ‘Tweezer Top’ candle at the high of $350 and witnessed a sharp correction. The prices plunged almost by 37% and made a low of $220. The asset was taking good support at $220 and started trading in an ‘Ascending Triangle’ pattern. BNB however, broke the pattern on the downside and saw another correction. It also broke the long held support of $220 and made a low of $203. BNb has made a ‘Morning Star’ pattern at the low. However, to witness a rally it needs to break, close and sustain above the crucial level of $220.
Weekly Snapshot:
| USD ($) | 31 Aug 23 | 07 Sep 23 | Previous Week | Current Week | |||
| Close | Close | % Change | High | Low | High | Low | |
| BTC | $25,931 | $26,240 | 1.19% | $28,089 | $25,753 | $26,409 | $25,363 |
| ETH | $1,646 | $1,648 | 0.12% | $1,743 | $1,627 | $1,657 | $1,603 |
| BNB | $216.60 | $216.89 | 0.13% | $233.06 | $214.27 | $217.97 | $211.59 |
| crypto | 1w – % Vol. Change (Global) |
| BitCoin (BTC) | 24.88% |
| Ethereum (ETH) | 25.73% |
| Binance Coin (BNB) | 12.18% |
| Resistance 2 | $32,500 | $2,150 | $0.95 | $255 |
|---|---|---|---|---|
| Resistance 1 | $28,500 | $1,750 | $0.75 | $220 |
| USD | BTC | ETH | Matic | BNB |
| Support 1 | $25,000 | $1,500 | $0.50 | $200 |
| Support 2 | $22,500 | $1,350 | $0.41 | $2180 |
Market Updates:
- The $41 million hack of crypto gambling site Stake was carried out by the North Korean Lazarus Group, the Federal Bureau of Investigation (FBI) stated in an announcement on Sept. 7. This group has stolen more than $200 million of crypto in 2023.
- The IMF and the FSB have published a joint paper containing policy recommendations at the request of the Indian G20 presidency.
- The race for the United States’ first spot Ethereum exchange-traded fund has officially begun after new 19b-4 filings by the Chicago Board Options Exchange, which will “ultimately start the clock” for a Securities and Exchange Commission decision.