Bitcoin is facing intense resistance near the $95,000 mark, as bulls and bears battle for control. Following the release of January’s Consumer Price Index, which showed a 0.5% monthly increase and a 3% year-over-year rise—exceeding economists’ forecasts of 0.3% and 2.9%—Bitcoin briefly dipped to $94,000. The hotter-than-expected inflation data dampened hopes for an imminent rate cut by the U.S. Federal Reserve.
Despite this setback, buyers swiftly regained momentum, pushing Bitcoin back above $95,000. While the crypto asset has remained range-bound for weeks, gold has been steadily climbing. Analysts anticipate that Bitcoin will eventually mirror gold’s strength and surge to a new all-time high.
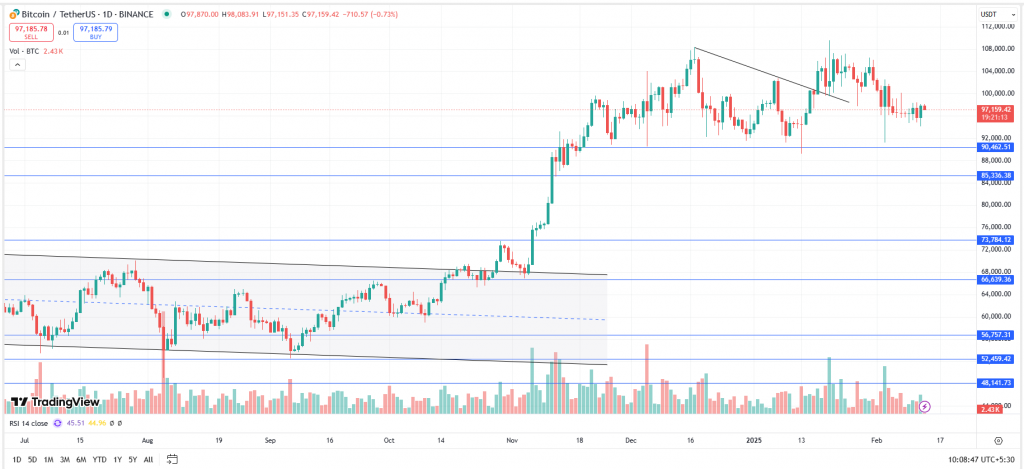
BTC-USDT Daily Chart:

BTC continues to trade sideways in a narrow range, from $100,000 to $94,000, over the past seven days. The asset has a good support zone from $85,000 to $90,000, whereas $110,000 will act as a strong resistance. To further rally, BTC needs to break, sustain, and close above $110,000.
Keep yourself ahead of the crypto curve with ZebPay blogs—click the button below and join 6 million+ users who trust ZebPay for their trading needs!


