

Over the last seven weeks, a negative technical formation has dragged down the overall crypto market capitalisation. Bitcoin’s 2% loss, as well as BNB’s 1.7% and XRP’s 2.5% declines, were the primary drivers of the most recent 1.3% correction between May 18 and May 25. The falling wedge formation initiated in April points to a possible breakout near $1 trillion in late July. For bulls, the bearish structure that took total capitalization to $1.11 trillion on May 25 means that an eventual breakout would require additional effort. Given the balanced demand in the futures markets, traders appear reluctant to place additional bets until there is more clarity on the US debt showdown. It is unclear if the crypto market will be able to break out of the falling wedge formation.
Bitcoin price has consolidated within a tight range as traders remain steady. While Bitcoin is typically a volatile asset, the weekly consolidation around a slight 3.4% price range has many analysts feeling BTC price is stuck. Others expect volatility to recover. While bitcoin’s lack of price action is due in part to longtime investors’ conviction and the influx of new liquidity into the market, BTC has still outperformed many assets in 2023. Realised bitcoin price liquidity remains cyclically low. This may be because many investors are breaking even near the current bitcoin price. The asset price is reflecting historically oversold levels with 9% of unrealized gains remaining in the market. The 7-day funding rate for BTC and Ether was neutral, indicating balanced demand for leveraged long positions (buyers) and short positions (sellers) using perpetual futures contracts. The put-to-call ratio for bitcoin options volume has been below 1.0 for the past two weeks, indicating a greater preference for neutral over bullish call options. More importantly, even when Bitcoin briefly corrected to $25,900 on May 25, there was no significant increase in demand for protective puts.
Similar concerns exist for Ether, which traded above $2,100 following the Shapella upgrade before falling to a 7-day low of $1,783 on May 24. The drop comes as Ether stays stuck below the $1,900 resistance level, with data indicating that an upward trend is unlikely in the near term. On May 23, the Ethereum deposit contract balance reached 22.6 million ETH or $41.1 billion, indicating a substantial increase since the implementation of the critical functionality that was not included during Ethereum’s transfer to the proof-of-stake (PoS) consensus after the Merge upgrade.
On the macro front, sticky inflation continues to alarm investors, who are pricing in higher odds of more interest rate increases by the Federal Reserve of the United States. The country’s most recent personal consumption expenditure index showed a 5% increase, well above the 2% inflation objective. A number of regulatory risks have also emerged as a result of various governments’ efforts to tighten their grasp on crypto assets. The most recent incident concerned the European Central Bank’s oversight authority, the European Systemic Risk Board (ESRB), which suggested special attention to bank-run concerns on stablecoins.
Technical Outlook
BITCOIN:
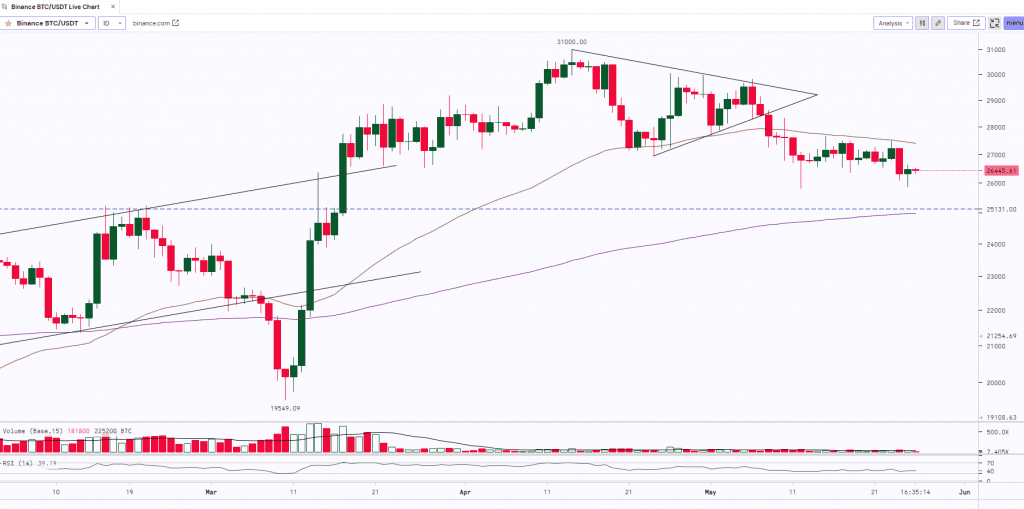
BTC after making a ‘Long Legged Doji’ candle at the recent top of $31,000 witnessed a profit booking and the prices corrected almost by 16% and made the low of $25,811. Post this move, the asset started consolidating and trading sideways in a range from $26,000 to $27,500. BTC yesterday, on a daily time frame, made a ‘Hammer’ candle (A bullish candle, however, with low volumes) which indicates buying around the support level of $25k. If the subsequent candle breaks the high of the previous candle ($26,632) then we may expect an upward movement. To witness a rally BTC needs to break the resistance of $28,000 and $32,500.
ETH:
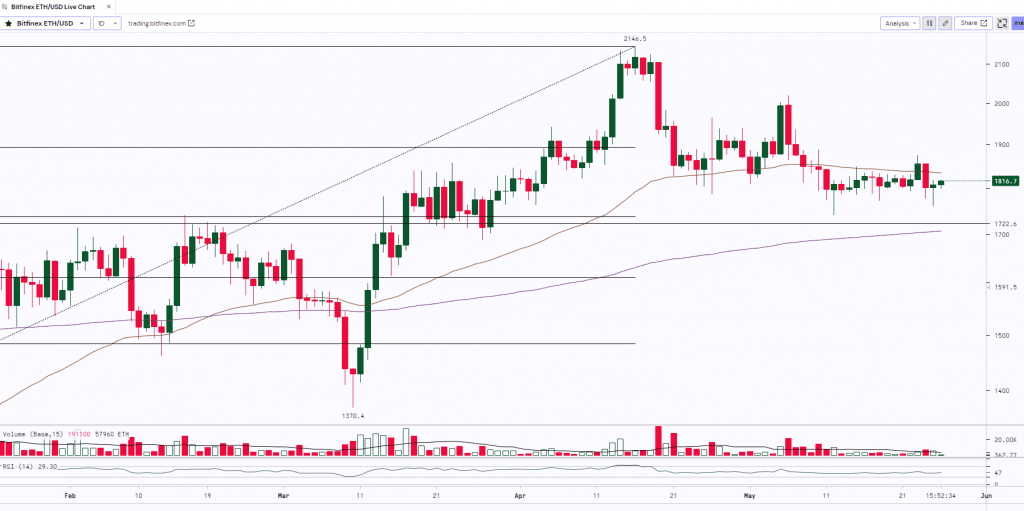
ETH after witnessing a rally from $1,370 to $2,146 started consolidating at the highs and trading sideways making small ‘Spinning Top’ candles that indicated indecision in trend. The bulls failed to manage the grip on the asset as it saw some profit booking and the prices dropped to $1,741.5. ETH made a ‘Hammer’ candle at the recent low where the lower longer shadow indicates buying around the support zone ($1,700- $1,725). Currently, on the daily time frame, ETH is consolidating and trading sideways and is resisting at its 50-Day Moving Average with low volumes. If it closes and sustains above the resistance then we can expect the prices to further rally up to the $2k mark.
BNB:
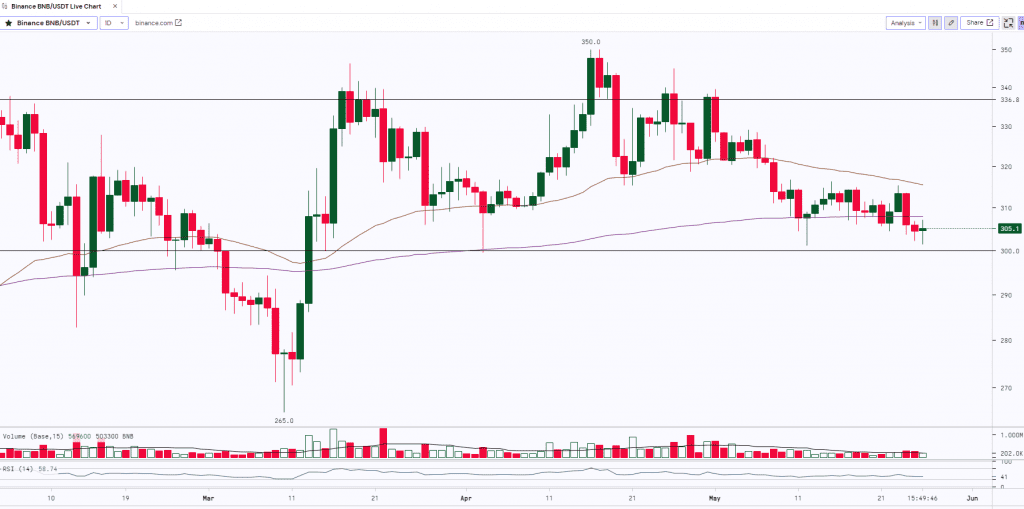
BNB after making a high of $350 made a ‘Tweezer Top’ Candle witnessed a profit booking and the prices plunged to $301. Post this move, the asset is consolidating and trading sideways in a range of $315 to $305. BNB is trying to take support at the key level of $300. If it holds and sustains above the support then we can expect the up-move whereas a break below $300 will lead to further downfall.
Monthly Snapshot
| USD ($) | 11 May 23 | 18 May 23 | Previous Week | Current Week | |||
| Close | Close | % Change | High | Low | High | Low | |
| BTC | $27,000 | $26,832 | -0.62% | $29,820 | $26,781 | $27,646 | $25,878 |
| ETH | $1,796 | $1,802 | 0.32% | $2,017 | $1,774 | $1,846 | $1,742 |
| BNB | $307.70 | $309.46 | 0.57% | $328.90 | $304.96 | $316.37 | $301.58 |
| Crypto | 1w – % Vol. Change (Global) |
| BitCoin (BTC) | -16.36% |
| Ethereum (ETH) | -29.10% |
| Binance Coin (BNB) | -17.43% |
| Resistance 2 | $32,500 | $2,000 | $1.30 | $350 |
|---|---|---|---|---|
| Resistance 1 | $28,000 | $1,850 | $0.95 | $336 |
| USD | BTC | ETH | Matic | BNB |
| Support 1 | $25,000 | $1,700 | $0.75 | $300 |
| Support 2 | $22,000 | $1,500 | $0.63 | $255 |
Market Updates
- The Bank for International Settlements (BIS) and a group of central banks have published a paper detailing their “ongoing policy perspectives” on a retail central bank digital currency (rCBDC). The new publication is the fifth from the same authors.
- Venture capital conglomerate Digital Currency Group (DCG) is closing its prime brokerage subsidiary TradeBlock, citing the state of the broader economy and an uncertain regulatory environment for crypto in the United States.
- Crypto exchange Gemini has selected Dublin as the headquarters for its European operations, amid a backdrop of crypto companies seeking expansion outside of the United States.

