
A drop in Ethereum’s price to $1,543, its lowest level in six months, could be attributed to a range of factors, including both positive developments and negative sentiments. While positive news, such as Visa’s interest in Ethereum and the potential for a spot ETH ETF, can provide a bullish outlook, the market’s overall sentiment can sometimes overshadow these developments. Market dynamics, including large liquidations, can have a significant impact on short-term price movements and create uncertainty among traders. Additionally, fear-driven sentiment can cause investors to be cautious, leading to increased market volatility.
At the time of writing, ETH was trading at $1,578.
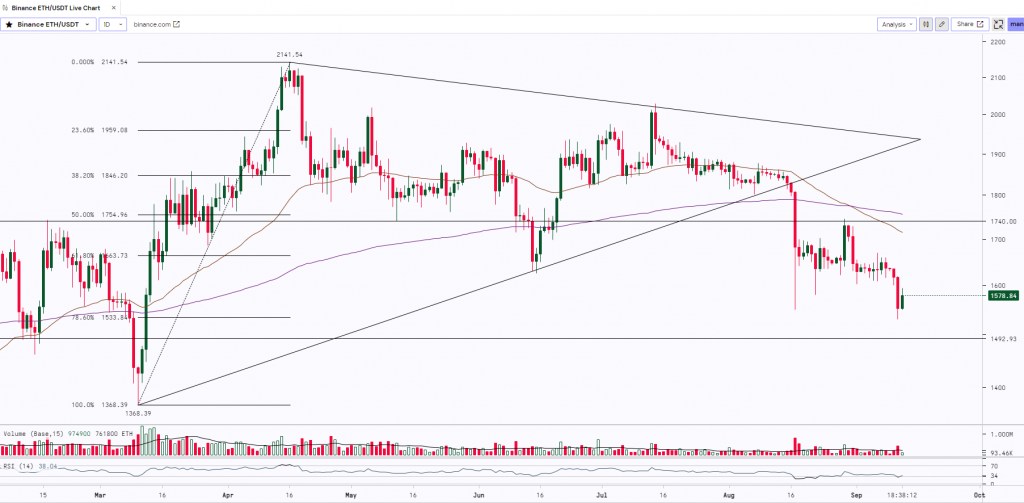
ETH was trading sideways in a range from $1,600 to $1,650 over the last week. Yesterday, the asset finally gave a breakout on the downside of the range and made a low of $1,531. ETH has a very strong support zone from $1,535 to $1,500 (78.6% Fibonacci Retracement Level & Horizontal Trendline), and it has bounced from the support level. However, to witness a rally ETH needs to break and close above the major resistance level of $1,750. If the asset breaks and closes below $1,500 then we may expect the prices to test the next support level which is at $1,350.
Key Levels:
| Support 2 | Support 1 | Asset | Resistance 1 | Resistance 2 |
| $1,350 | $1,500 | ETH | $1,750 | $2,150 |