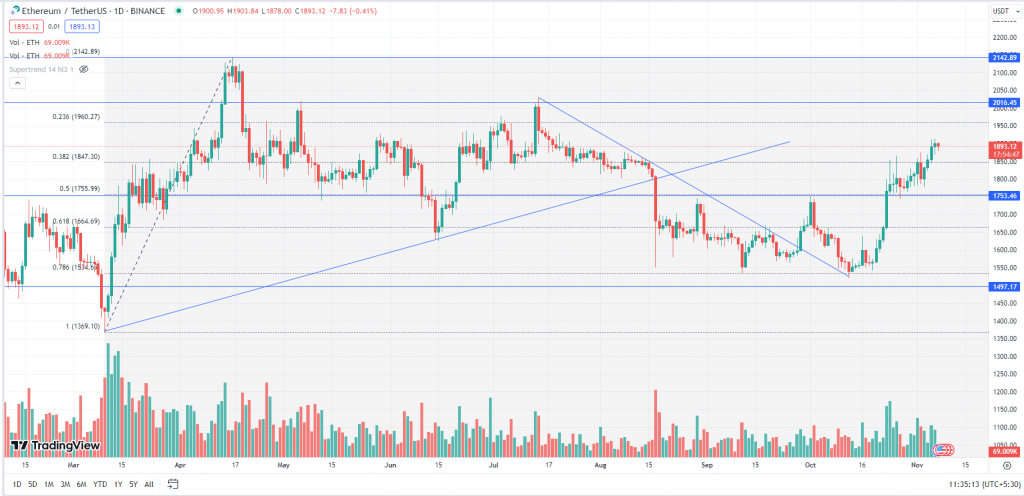
Between November 3rd & 5th, the price of Ether experienced a notable 6.2% increase. However, Ether has been encountering resistance at the $1,900 level, making it challenging to break through. One of the key issues currently affecting the Ethereum network is the persistently high gas fees associated with transactions, including those initiated by smart contracts. The seven-day average transaction fee has been averaging $4.90, which has had a detrimental impact on the usability of DApps. Furthermore, the total Ether deposits on the Ethereum network have dwindled to their lowest levels since August 2020.
At the time of writing, ETH was trading at $1,892.

Image Source: Trading View
ETH after taking multiple supports at the key level of $1,530 (78.6% Fibonacci Retracement Level) started moving up by forming a ‘Higher High Higher Low’ pattern. The asset broke the long-held resistance of $1,750 and rallied up to $1,865. ETH retested the support of $1,750 and made a weekly high of $1,914. The asset has a strong resistance zone from $1,950 to $2,000. Once it crosses the key resistance it may rally and test the previous high of $2,142.
| Support 2 | Support 1 | Asset | Resistance 1 | Resistance 2 |
| $1,525 | $1,750 | ETH | $1,950 | $2,150 |


