TRON (TRX) has recently demonstrated significant growth in terms of user engagement and transaction volume, positioning itself as a prominent player in the blockchain space. With an impressive 1.1 million daily active users and a remarkable 4.8 million daily transactions, TRON has firmly established its position as a leading blockchain platform. Analysing the technical indicators on the TRX chart reveals a dynamic struggle between buyers and sellers, resulting in price fluctuations ranging from $0.07 to $0.09. This volatility underscores the intense competition within the market, as investors assess the potential of the TRX token.
At the time of writing, TRX was trading at $0.0894.

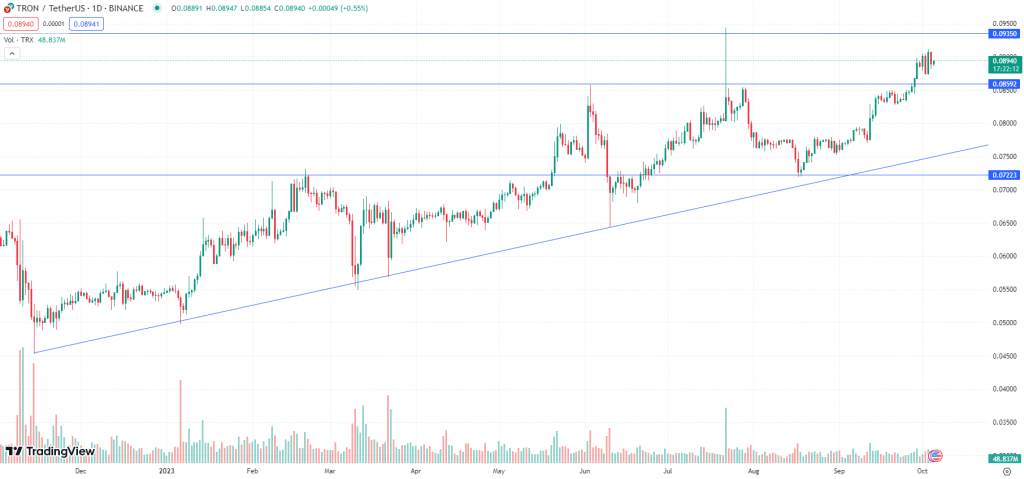
TRX has been trading in an uptrend over the past ten months and the prices have surged by almost by 120% from the low of $0.0425. The asset broke the key resistance of $0.085 and made a high of $0.09439. Currently, TRX is consolidating between $0.09 to $0.087, once it breaks the recent high of $0.093 then it may further rally and test $0.105 levels whereas $0.085 will act as a strong support for the asset.
Key Levels:
| Support 2 | Support 1 | Asset | Resistance 1 | Resistance 2 |
| $0.077 | $0.085 | BCH | $0.0935 | $0.105 |


