
05 March 2021 | ZebPay Trade-Desk
Bitcoin has seen a correction this week, now fluctuating between $45,00-$49,000. The largest crypto asset by market capitalization however held up volumes. Ether is following suit, and also witnessed a correction and is currently trading between $1,450-$1,650. Ether though continues to benefit from incredible interest among crypto enthusiasts, and the industry. Institutional flows are strong, which is reflected by strong volumes. Altcoins have also shown an upward trend, with BAT leading the pack and hitting a $1bn market cap this week, following its upward rally. Let’s have a look at what some of these assets have in store for us.
Bitcoin (BTC) Technical Analysis and Chart:
At the time of writing, Bitcoin is trading around $46,850 reflecting a gain of about 0.7% approximately over the period of 24-hours.
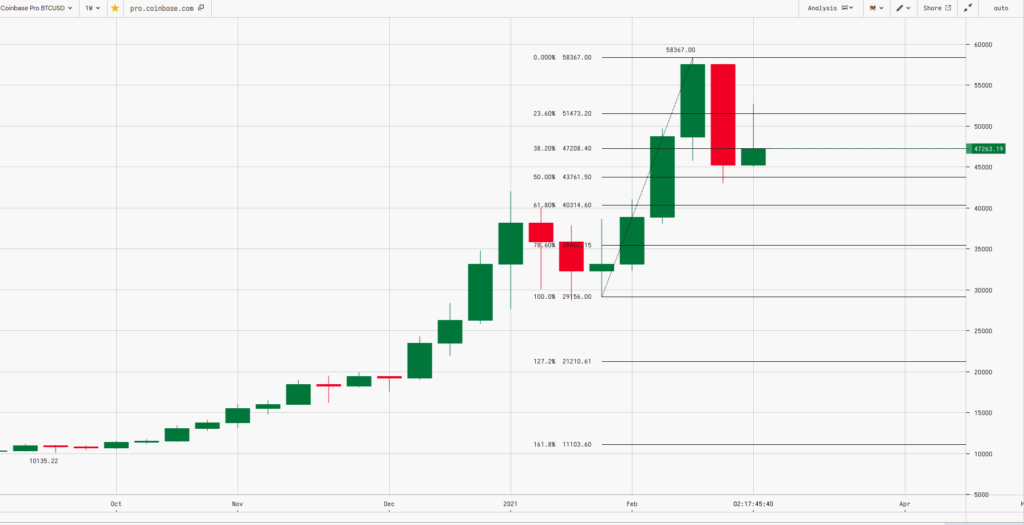
Bitcoin has seen a downward trend this week, losing over 10% over the previous week. However, BTC continues to see strong inflows after the correction, and volumes have also held up strongly. Hence overall sentiment is still positive.
As mentioned in the last report, Bitcoin finally made a ‘Bearish Belt Hold’ pattern last week and this week too long upper shadow shows selling at higher levels indicating weakness ahead. According to Fibonacci retracement, the asset is trying to resist at $47,208.4 levels (38.2%) and the next key support levels are at $43,761 and $40,367 levels. Hence, we conclude that unless the resistance is broken we may see further weakness in the asset and the prices may come to test the support levels.
Institutional flows remain good, and the picture remains positive. Tactically $43,761and $40,367 are acting as good support and dips accumulation remains an attractive strategy.
Ethereum (ETH) Technical Analysis and Chart:
At the time of writing, Ethereum is trading around $1,460 reflecting a loss of about 5% approximately over the period of 24-hours.
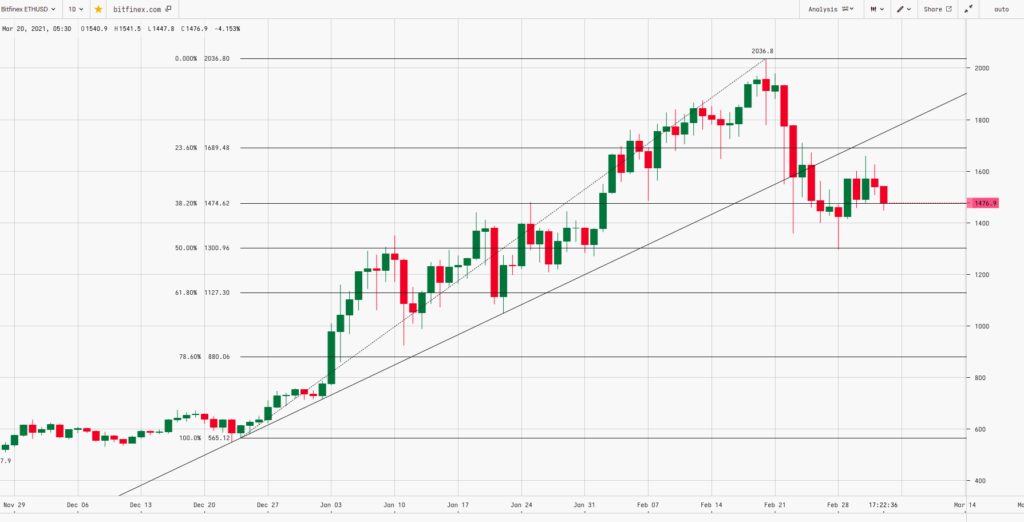
ETH saw a correction this week and hit a low of $1,300. This is the first real correction the asset has witnessed since the start of this year after it witnessed its most recent ATH of $2,036. It saw a big fall to $1,500 levels, recovering after to $1,800 levels, before falling back to $1,450 levels again. Binance faced a withdrawal suspension that prevented users from withdrawing ETH and other ERC-20 tokens, which could have further enhanced this price fall, and also could be a reason for lower volumes this week.
As we mentioned in the previous report, ETH was trading below the trendline support which in turn helped the bears take control and we saw heavy selling in the asset which made the low of $1,296. As per the daily chart, though it bounced exactly from $1,300 levels (50% Fibonacci Retracement level) it is currently consolidating and trading in a range from $1,410 levels to $1,675 levels. Breakouts on either side will decide the further trend for ETH.
ETH may see a bull run if it breaks the resistance level of $1,675 and $1,982.
Basic Attention Token (BAT) Technical Analysis and Chart:
At the time of writing, BAT is trading around $0.66 reflecting a loss of about 4% approximately over the period of 24-hours.
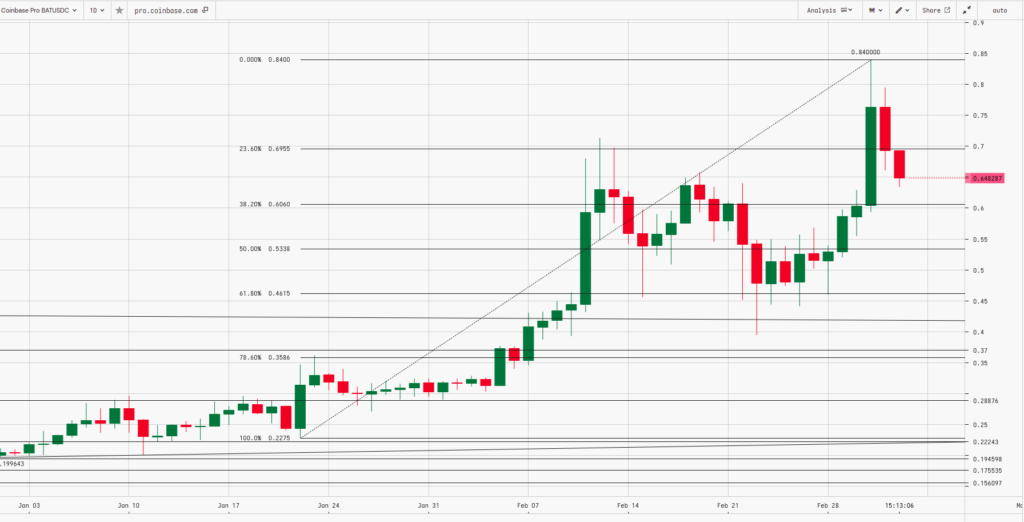
BAT has achieved a groundbreaking development, and basis which the Basic Attention Token (BAT) just hit a $1B market cap earlier this week, and we remain optimistic on the asset moving forward.
As we can see from the above weekly chart, BAT has given a sharp rally from its support zone of $0.53 ( 50% Fibonacci Retracement level) which helped the asset soar to an all-time high of $0.84 giving a return of 61% in a week. On a daily chart, post making the new all-time high, the last two sessions the asset is trying to make lower top lower bottom formation indicating profit at higher levels. Further support levels come in at $0.606 and $0.533 and we believe it may bounce after testing these levels. Further upside can be seen once the resistance of $0.75 and $0.84 is broken convincingly.
For BAT to further rally, it would have to break the crucial resistance level of $0.75 and $0.84 needs to sustain above that.
Uniswap (UNI) Technical Analysis and Chart:
At the time of writing, UNI is trading around $27.20 reflecting a loss of about 4% approximately over the period of 24-hours.
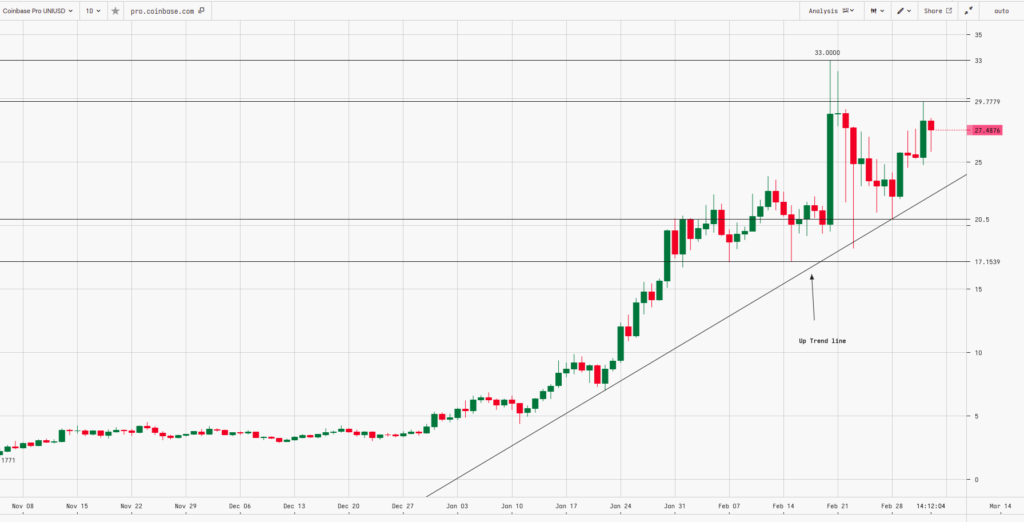
Uniswap has seen a good upward trend through this year, and we remain optimistic on the asset moving forward. UNI serves the purpose of creating a highly sustainable decentralized financial infrastructure that promotes shared community ownership. Uniswap has become a key player in the DeFi space, and since the protocol has undergone an upgrade, it has seen significant traction and interest among crypto enthusiasts and investors.
As per the daily chart, Uniswap has started its upward journey from January 2021 and in a month’s time, it made an all-time high of $33 giving almost 266% returns. Post this feat, it corrected almost 45% dragging the prices up to $18.2. On a technical front, Uniswap is trading in an uptrend and we see that every time the price touches the trendline the bulls take charge, and the asset bounces. As per the chart, $20.5 and $17.15 will act as support zones whereas $29.77 and $33 are the resistance levels respectively.
For UNI to further rally, it would have to break the crucial resistance level of $29.77 and $33 needs to sustain above that.
USDT-INR Technical Analysis and Chart:
At the time of writing, USDT-INR is trading around $76.50 reflecting a gain of about 3% approximately over the period of 24-hours.
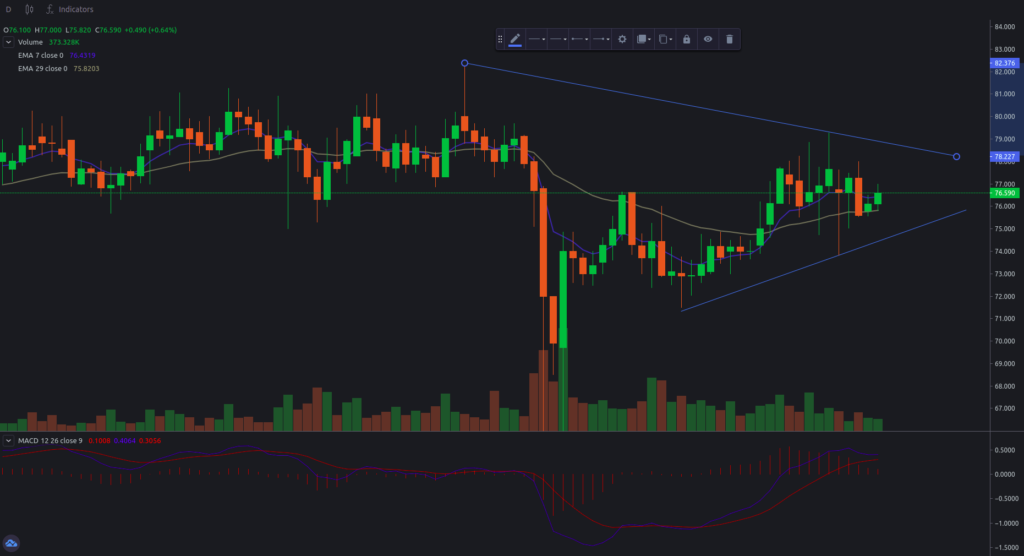
The pair is operating with ~7% premium, compared to its traditional counterpart, which is what the Indian marketplace is traditionally used to. This is positive news as this means the market is returning to its normal ways of operation, first time since the crypto bill discussion was brought up in Parliament. Hence, we have seen a recovery, and currently, USDT-INR is trading in a range-bound fashion, between $75.50-$77.50. We can see USDT is taking support at $75.03 levels, and resistance at a level of $78.
There has been a correction in BTC and ETH, which is why Bitcoin and Ether traders might have built up their holding in these assets using their stable coins (USDT), in hope for another upward rally. The overall sentiment in the crypto space is positive, and continues to grow, leading to the appreciation in the USDT-INR pair, and resorting $75+ levels this week. Though the ramifications of the bill that is currently being debated in Parliament remain ambiguous, we still believe that the USDT-INR has in fact recovered significantly, and do anticipate a slight upward movement to continue, especially since the traditional USD-INR pair is likely to see a depreciating trend this month. Hence, in this light, we are bullish on the pair, as we expect inflows to get stronger over the month.
Weekly Trade Summary Sheet:
Weekly Price Analysis:
| USD ($) | 25 Feb 21 | 04 Mar 21 | Previous Week | Current Week | |||
| Close | Close | % Change | High | Low | High | Low | |
| BTC | $49,705 | $48,561 | -2.30% | $58,331 | $32,384 | $52,535 | $43,242 |
| ETH | $1,627 | $1,542 | -5.21% | $2,036 | $1,274 | $1,650 | $1,300 |
| BAT | $0.515 | $0.694 | 34.73% | $0.634 | $0.292 | $0.835 | $0.444 |
| UNI | $23.270 | $28.260 | 21.44% | $32.630 | $18.530 | $27.570 | $20.630 |
Weekly Volume Analysis:
| Cryptocurrency | 1w – % Vol. Change (Global) |
| Bitcoin (BTC) | 31.42% |
| Ethereum (ETH) | -17.00% |
| Basic Attention Token (BAT) | 25.09% |
| UniSwap (UNI) | -48.60% |
Weekly Price Pointers:
| Resistance 2 | $58,367 | $1,982 | $0.840 | $33.00 |
| Resistance 1 | $51,473 | $1,675 | $0.715 | $29.77 |
| USD | BTC | ETH | BAT | UNI |
| Support 1 | $43,761 | $1,410 | $0.606 | $20.50 |
| Support 2 | $40,367 | $1,300 | $0.533 | $17.15 |
Market Updates:
- On-chain metrics for BTC and ETH show a marked decrease in the dollar value of transactions and the subsequent transaction fees.
- A Huobi subsidiary has been given the green light to operate a crypto investment fund by regulators in Hong Kong.
- Grayscale added 174,000 tokens to its litecoin holdings in the past month.
- Switzerland’s Crypto Valley is continuing to grow despite the Covid-19 pandemic, with its top 50 companies increasing in value by more than $200 billion in less than one year.
*Sources of charts: https://cryptowat.ch, https://pro.zebpay.com/trade/USDT-INR
Disclaimer : This report is not intended to be relied upon as advice to investors or potential investors and does not take into account the investment objectives, financial situation or needs of any investor. All investors should consider such factors in consultation with a professional advisor of their choosing when deciding if an investment is appropriate. The Company has prepared this report based on information available to it, including information derived from public sources that have not been independently verified. No representation or warranty, express or implied, is provided in relation to the fairness, accuracy, correctness, completeness or reliability of the information, opinions or conclusions expressed herein. This report is preliminary and subject to change; the Company undertakes no obligation to update or revise the reports to reflect events or circumstances that arise after the date made or to reflect the occurrence of unanticipated events. Trading & Investments in cryptocurrencies viz. Bitcoin, Bitcoin Cash, Ethereum etc.are very speculative and are subject to market risks. The analysis by Author is for informational purposes only and should not be treated as investment advice.

