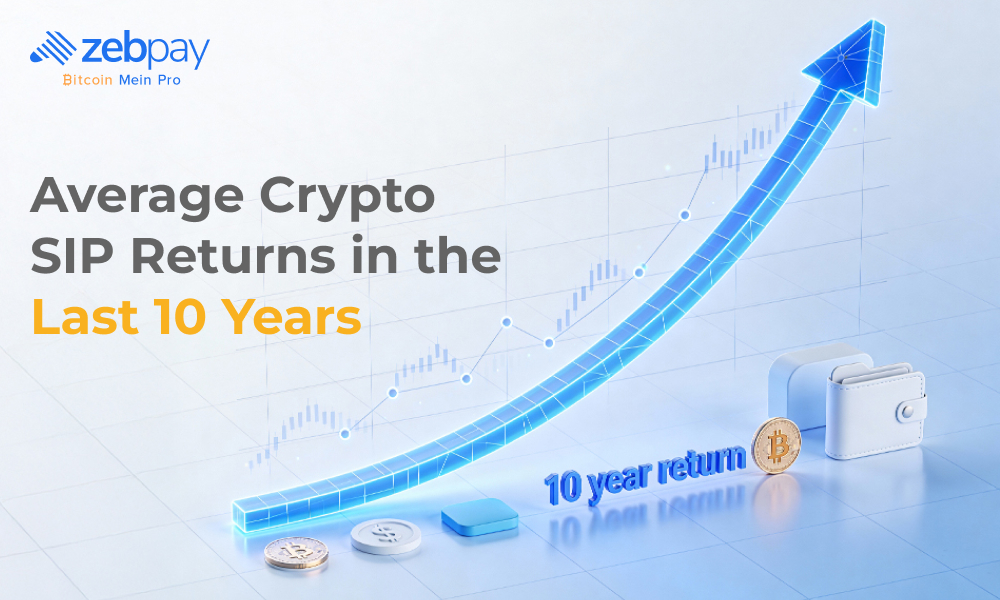
Imagine investing just ₹1,000 every month in a Bitcoin SIP starting in 2016, without trying to time the market, through multiple bull runs and brutal crashes. By early 2026, that disciplined crypto SIP approach would have turned a total investment of roughly ₹1.2 lakh into an estimated ₹35–55 lakh.
This is the core strength of a crypto SIP (Systematic Investment Plan). Instead of chasing highs or panicking during drawdowns, you invest in SIP at fixed intervals using a crypto SIP app, allowing rupee-cost averaging to smooth volatility over time.
In this blog, we will go in-depth and understand the average return on crypto (majorly Bitcoin) sip.
Why Is Crypto SIP Beneficial for Long-Term Investors?
One of the biggest mistakes new investors make is trying to predict short-term price movements. Crypto markets are notoriously volatile, with Bitcoin experiencing multiple drawdowns of 70–80% since inception. A crypto SIP removes emotion from investing by enforcing consistency.
When prices fall sharply, as seen in 2018 or 2022, your fixed monthly Bitcoin SIP automatically accumulates more BTC at lower prices. When markets recover, those accumulated units compound in value. Over long periods, this averaging effect lowers the effective purchase cost and improves recovery outcomes.
For crypto SIP in India, the model fits naturally with monthly income cycles. Setting up an automated SIP aligns investing with cash flow, reduces decision fatigue, and promotes discipline.
How Is Crypto SIP Helping Investors Diversify Their Portfolio?
Traditional portfolios typically rely on equities, debt, and gold. However, during global stress events, correlations between these assets tend to rise, reducing diversification benefits. Crypto SIP, particularly exposure to Bitcoin and Ethereum, introduces an asset class with historically lower long-term correlation to equities.
A practical allocation example:
- ₹6,000/month in equity mutual funds
- ₹3,000/month in Bitcoin SIP
- ₹1,000/month in gold or debt
Over long periods, even a 10–20% crypto allocation has historically improved portfolio returns, while drawdowns were manageable due to SIP-based averaging. During bear markets, crypto SIPs continue accumulating units, positioning the portfolio for recovery when sentiment turns.
With crypto SIP apps enabling fractional purchases, investors can start with as little as a few hundred rupees, making diversification accessible even for beginners.
What Is the Average Return on a Crypto SIP?
The average crypto SIP return is best measured using XIRR, which accounts for the timing of each investment. This is far more accurate than simple CAGR when evaluating regular contributions.
Based on historical INR-adjusted data:
- Bitcoin SIP (2016–2026): ~45–60% XIRR
- Ethereum SIP (2017–2026): ~35–50% XIRR
- Nifty 50 SIP (same period): ~12–14%
- Gold SIP: ~7–9%
These figures already account for major crashes, long consolidation phases, and currency effects. While crypto SIP returns are volatile year-to-year, long-term performance has remained structurally superior due to Bitcoin’s supply constraints and adoption growth.
How Is the Crypto SIP Return Calculated?
Crypto SIP returns are calculated using XIRR, which evaluates multiple cash flows over time.
Example (₹1,000 monthly Bitcoin SIP for 10 years):
- Total invested: ~₹1.2 lakh
- Final value (early 2026 estimate): ₹40 lakh
- XIRR: ~52%
The formula is simple in Excel or Google Sheets:
=XIRR(values, dates)
Most crypto SIP apps provide built-in calculators, but investors should understand the mechanics to avoid unrealistic expectations. Bitcoin SIP returns in rupees will vary depending on start date, frequency, and market cycles.
Historical Data on Bitcoin SIP Returns
Below is a realistic illustration of Bitcoin SIP behaviour across market phases:
| Period | Market Phase | SIP Outcome | Key Characteristics |
| 2016–2017 | Early bull | Strong accumulation | ₹400 weekly bought BTC from ₹3L → ₹15L; averaged ₹6L cost vs lump-sum ₹9L |
| 2018 | Deep bear | 40–50% drawdown | -84% BTC crash; SIP limited losses to -45% while accumulating 3x more coins |
| 2019–2020 | Recovery | Average cost advantage | COVID dip (₹4L → ₹10L); SIP averaged ₹6L vs lump-sum ₹8L entry |
| 2021 | Bull peak | Portfolio expansion | ₹10K monthly → 0.15 BTC total; value 8x from 2018 lows despite $69K top |
| 2022 | Macro bear | Temporary decline | -75% drawdown; SIP -15% vs lump-sum -70%; bought ~0.35 BTC/₹1.2L invested |
| 2023–2025 | Post-halving recovery | Strong compounding | 2024 halving rally; ₹1L invested → ₹3.2Cr (280% XIRR); 15x bear recovery gain |
SIP Returns During Bull and Bear Markets
Bull Market
A bull market refers to a period of sustained rising prices and strong investor optimism. In crypto and traditional finance, it’s commonly defined as price increases of 20% or more over time as buyers outnumber sellers and demand pushes values higher. In crypto, bull runs often coincide with major adoption waves, macro tailwinds, or Bitcoin halving cycles.
Bear Market
A bear market is a prolonged period of falling prices and negative sentiment, usually marked by a decline of 20% or more from recent highs. In crypto, these periods can be sharper and deeper than in stocks, and sentiment shifts from greed to fear
Bull vs Bear Price Action (Generic Market Chart)
In this chart, you will know the Bitcoin price trend and sentiment during bull and bear markets.
| Phase | Price Trend | Sentiment | Bitcoin |
| Bull Market | Higher highs & higher lows | Optimism, inflows | BTC rises from $10k → $64k+ (2020–21) |
| Bear Market | Lower highs & lower lows | Fear, outflows | BTC drops ~75% from $69k peak in 2022 |
| Transition | Trend reversal | Shift in supply/demand | Post-peak sell-offs begin (2021 top → 2022 bear) |
Why Is Bitcoin SIP Important?
Bitcoin remains the most established crypto asset, with:
- Dominant market share (~50%+)
- Fixed supply of 21 million
- Predictable halving cycle (latest in 2024: reward cut to 3.125 BTC/block)
- Growing institutional participation via spot ETFs and corporate treasuries
For Indian investors, Bitcoin SIP returns in India benefit from both price appreciation and INR depreciation over time. While crypto SIP in India carries regulatory and tax considerations, Bitcoin’s long-term risk-adjusted performance remains unmatched among digital assets.
Conclusion
Over the past decade, average crypto SIP returns, especially for Bitcoin, have demonstrated the power of consistency over timing. A disciplined Bitcoin SIP approach has historically delivered 45–60% annualised returns, transforming modest monthly investments into substantial long-term wealth.
While crypto SIP involves volatility and drawdowns, its ability to average costs, reduce emotional bias, and capture full market cycles makes it a compelling strategy for long-term investors. For those asking is crypto SIP safe, the answer lies in patience, diversification, and realistic expectations, not short-term performance.
FAQs
Bitcoin SIP return over the last 10 years?
Historically ~45–60% XIRR depending on start date and frequency.
Is SIP safe during crypto bear markets?
SIP does not prevent drawdowns but improves recovery and long-term outcomes.
How to calculate crypto SIP returns?
Use XIRR with investment dates and final portfolio value.
Why choose Bitcoin SIP over altcoins?
Bitcoin offers superior liquidity, adoption, and long-term risk-adjusted returns.
Best frequency for Bitcoin SIP?
Weekly SIPs slightly improve averaging, while monthly SIPs offer simplicity.