





Bitcoin continues to struggle below the $65,000 mark after another failed attempt to break higher. Spot data remains mixed, with $412 million in net outflows suggesting some accumulation as coins leave exchanges, although the scale remains modest. Meanwhile, a minority Bitcoin chain linked to BIP-110 has seen activity nearly stop after separating from the main network on August 9. It produced just two blocks in its first eight hours, compared with 48 blocks on the main chain during the same period.
The stronger bullish signal is institutional demand. U.S. spot Bitcoin ETFs recorded $853.5 million in net inflows from August 3–7, marking five consecutive positive sessions and their best weekly inflow since April. BlackRock’s IBIT captured a significant share of the demand, while total Bitcoin ETF assets have risen to around $80 billion, providing renewed institutional support for BTC.
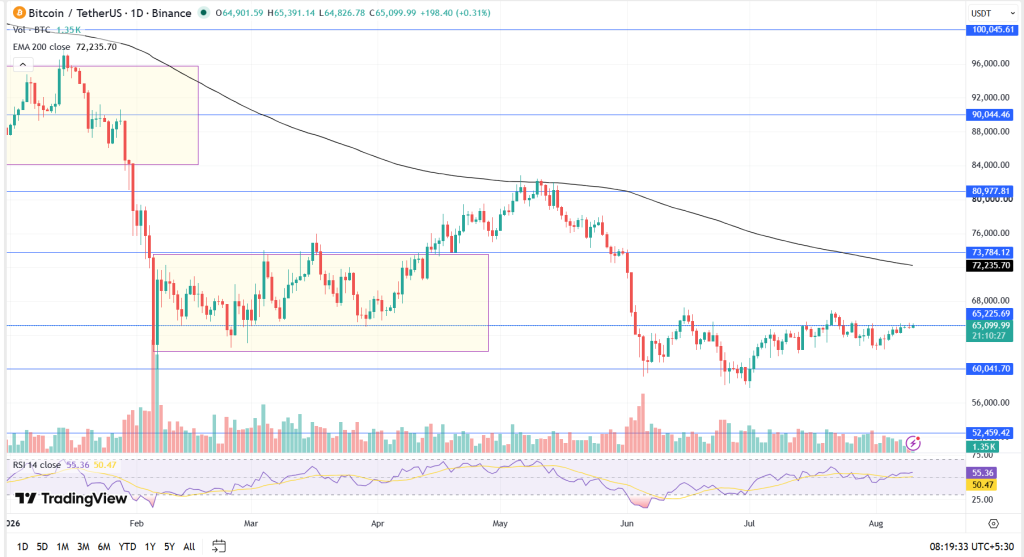
At the time of writing, BTC was trading at $65,225.
Also Read: What is Bitcoin Options Trading? A Beginner’s Guide
BTC, on a daily time frame, continues to consolidate and trade in a range between $60,000 and $67,000 with low volumes. Breakouts on either side of the range will further determine the trend for the asset. If the price breaks the recent low of $57,800 and closes below the key support of $60,000, then we can expect further downside, and the price may test the next support at $52,000.
Key Levels
| Support 2 | Support 1 | Asset | Resistance 1 | Resistance 2 |
| $52,000 | $60,000 | BTC | $70,000 | $84,500 |
Unravel everything that you need for your crypto journey via ZebPay blogs. Get started today and join 6 million+ registered users on ZebPay!