


Here is a technical analysis of ETH/USDT on a daily timeframe:
Market Structure
Ethereum is still moving within a broader downtrend. Nothing has changed in the bigger picture. The price bounced from $1,800, but it has failed to create strong higher highs, which indicates that buyers remain weak overall. Right now, the structure is:
- Short-term: Sideways to slightly bullish
- Overall trend: Bearish
Also Read: A Journey That Began in 2017: Shashi’s Story with ZebPay
Recent Price Action
Earlier, ETH was moving within a rising channel, showing short-term strength. Now, here’s what has happened:
- Price attempted to move higher toward $2,300–$2,400
- Got rejected again from that zone
- Dropped back near $2,050-$2,100
- Currently trying to stabilize
This clearly indicates that buyers are unable to push the price higher.
Volume is Supportive but Not Strong
- No strong volume during upward moves
- Volume is relatively average
- No signs of aggressive accumulation
This does not indicate a strong bullish move.
Also Read: Shiba Inu Price Prediction
Resistance Levels
- $2,200 – Immediate Resistance (The price is struggling below this level again)
- $2,300–$2,400 – Strong Resistance (Multiple rejections from this zone, with sellers clearly active here)
- $2,700–$2,800 – Major Resistance [This remains the level that needs to be broken for a true trend reversal (still far away for now)]
Support Levels
- $2,000 – Immediate Support (A very important level right now, with the price hovering just above it)
- $1,800 – Strong Support (If the price drops here again, it suggests that the entire bounce has failed and further downside is possible)
At the time of writing, ETH was trading at $2,072.
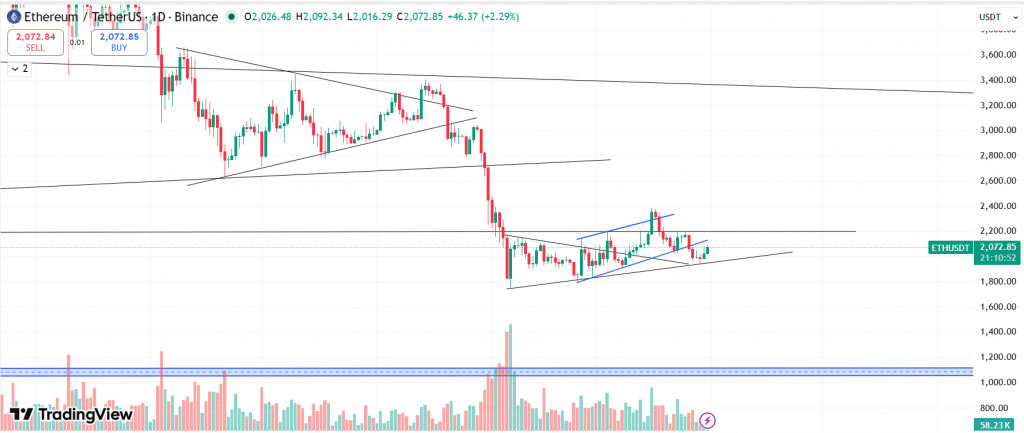
Summary: Ethereum is currently trading around $2,070 and moving sideways after failing multiple times to break above the $2,200–$2,400 resistance zone. Although there was a bounce from $1,800, the price has not shown strong follow-through, and buying momentum remains weak with no significant volume support. This suggests the move is more of a temporary recovery rather than a true trend reversal. As long as ETH remains below $2,200, the overall structure stays bearish, and a drop toward $2,000 or even $1,800 remains possible if support breaks.
Also Read: Dogecoin Price Prediction
Key Levels
| Support 2 | Support 1 | Asset | Resistance 1 | Resistance 2 |
| $1,800 | $2,000 | ETH | $2,200 | $2,400 |
In the grand scheme of things, ZebPay blogs are here to provide you with crypto wisdom. Get started today and join 6 million+ registered users to explore endless features on ZebPay!