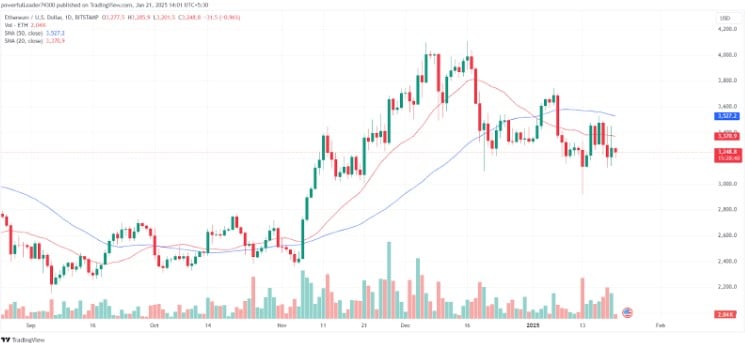
Ether bulls are actively defending the neckline of the head-and-shoulders pattern but are facing resistance near the 50-day SMA ($3,527). The downward-sloping 20-day EMA ($3,371) and the RSI (45.37), hovering around the midpoint, indicate that bears have a slight edge. For buyers to signal a reduction in selling pressure, they must push and maintain the price above the 50-day SMA. Between January 14th and 21st, the asset briefly attempted to surpass the 20-day SMA but ultimately corrected lower.
At the time of writing, ETH was trading at $3,256.8.

Weekly Analysis
Ether experienced a sharp correction after reaching a recent high of $4,107, failing to sustain and close above the $4k mark. The price corrected by nearly 29%, reaching a weekly low of $2,920. The longer lower shadow around the key support level of $3,000 suggests buying interest at these levels. If the asset holds and sustains above the $3,000 mark, bulls may look to resume the upward movement. A stronger rally would be supported by the asset surpassing the 50-day moving average, with higher RSI levels confirming that bulls are in control.
| Support 2 | Support 1 | Asset | Resistance 1 | Resistance 2 |
| $2,850 | $3,000 | ETH | $3,500 | $3,750 |
Unravel everything that you need for your crypto journey via ZebPay blogs. Get started today and join 6 million+ registered users on ZebPay!


