



Here is a technical analysis of ETH/USDT on the daily timeframe:
Market Overview
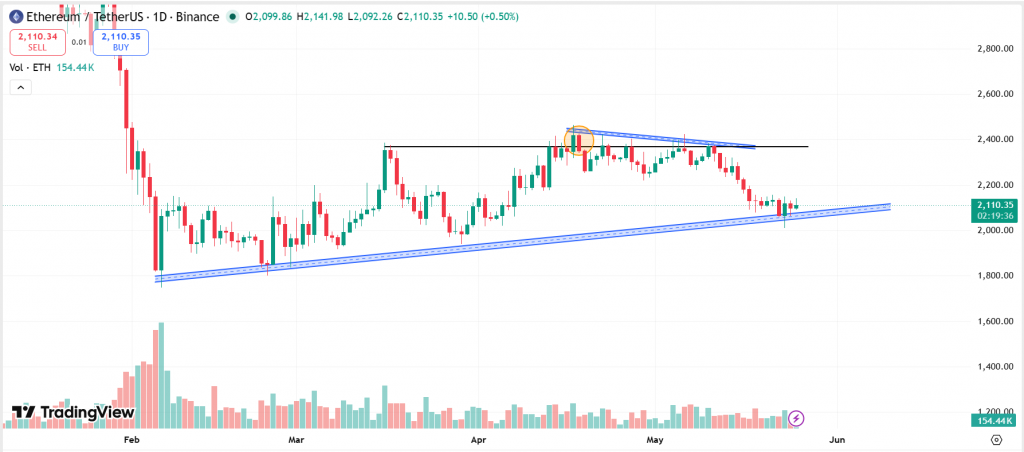
Ethereum is currently trading around $2,110 on the daily timeframe and continues to respect a broader ascending support trendline that has been developing since the February lows near $1,780. The price recently failed to sustain momentum above the $2,350-$2,400 resistance zone and has now pulled back toward mid-range support levels.
The market structure remains constructive overall because higher lows are still being maintained, but short-term momentum has weakened after repeated rejections from resistance.
Recent Price Action
The chart shows that ETH attempted multiple pushes toward the $2,400 resistance area, but sellers consistently defended the upper descending trendline. The highlighted rejection zone near $2,380 suggests strong selling pressure from that region.
Following the rejection, ETH experienced a gradual decline toward the rising trendline support near $2,050-$2,100. At the moment, the price is consolidating close to support while attempting to stabilize.
Also Read: What is a Crypto Wallet? An Explanation!
Current Structure and Trend
The broader trend remains cautiously bullish because the market is still forming higher lows on the daily timeframe. The ascending support line remains the key structure holding the current trend together.
However, ETH is also trading beneath a short-term descending resistance trendline, creating a compression structure that could lead to a breakout move in the coming sessions.
This suggests that:
- Buyers are still defending the long-term support zone
- Sellers remain active below $2,400
- Market volatility is compressing ahead of the next directional move
Volume and Momentum
Volume appears relatively moderate during the current pullback phase. There is no aggressive panic selling visible, which suggests that the decline is currently corrective rather than a full bearish reversal.
Momentum indicators based on price behavior suggest that ETH is losing short-term strength, but as long as the ascending support trendline continues to hold, buyers still have an opportunity to regain control.
A strong breakout above the descending resistance line with increased volume would likely confirm bullish continuation, while a breakdown below the ascending support could trigger deeper downside pressure.
At the time of writing, ETH was trading at $2,110.
Summary
Ethereum is currently consolidating near $2,110 after failing to break above the $2,400 resistance zone. The daily structure still favors a medium-term bullish outlook because higher lows remain intact and the ascending trendline continues to act as support.
In the short term, ETH is trapped between rising support and descending resistance, suggesting that the market is building pressure for its next major move.
A confirmed breakout above the $2,350-$2,400 range could reopen bullish momentum toward higher resistance levels, while a breakdown below $2,000 would significantly weaken the current structure.
Also Read: What is Blockchain? All About Blockchain Technology!
Key Levels
| Support 2 | Support 1 | Asset | Resistance 1 | Resistance 2 |
| $1,900 | $2,000 | ETH | $2,350 | $2,500 |
In the grand scheme of things, ZebPay blogs are here to provide you with crypto wisdom. Get started today and join 6 million+ registered users to explore endless features on ZebPay!