



Market Overview
BTC is maintaining a strong bullish structure on the daily chart, but the price action has started showing signs of short-term exhaustion after the sharp rally from the $76,000 to $77,000 region. The important development on the chart is the transition from the earlier $63,000 to $67,000 accumulation range into the $76,000 to $77,000 range, followed by a strong breakout above the $81,500 to $82,000 resistance zone. This breakout was supported by a noticeable increase in volume, which gives the move more significance.
BTC subsequently accelerated toward approximately $87,000, where the market faced clear selling pressure. Since then, the price has pulled back and is currently consolidating around $83,000 to $85,000. What stands out on the current chart is that BTC has not yet lost the previous breakout zone around $81,500 to $82,000. Therefore, the recent decline from $87K currently looks more like a pullback after a strong expansion rather than a confirmed trend reversal. The market is now at an important stage where $82,000 support and 85,000 to $87,000 resistance are likely to determine the next meaningful move.
Also Read: The State of Crypto in India: H1 2026 Review & H2 2026 Outlook
Outlook
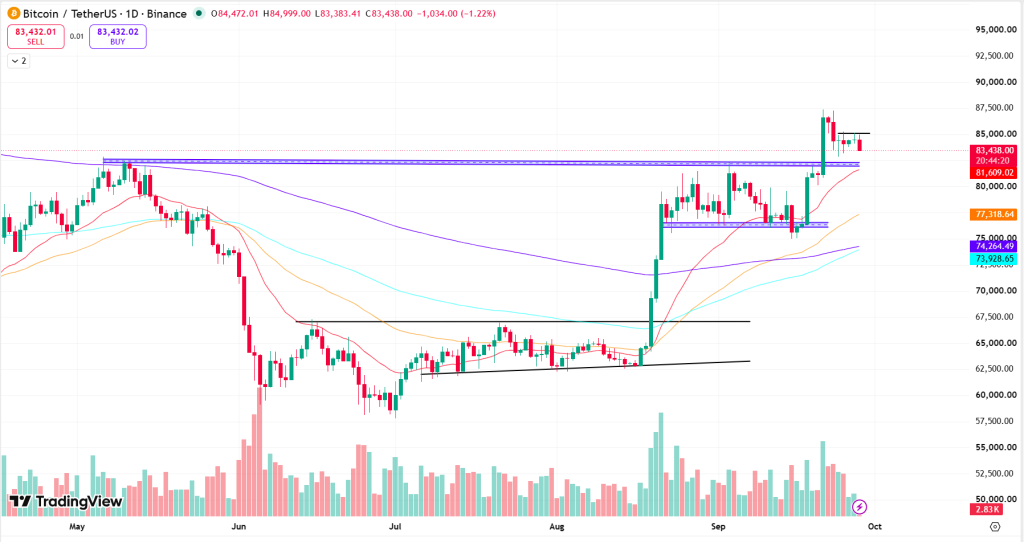
The daily structure remains bullish, but BTC is currently facing resistance around $85,000 to $87,000. A strong daily breakout above $87,000 with increasing volume could open the path toward $90,000, followed by $95,000. On the downside, a sustained break below 81,500 to 82,000 could bring $76,000 to $77,500 back into focus. A break below $76,000 would weaken the structure.
Key Levels
| Support 2 | Support 1 | Asset | Resistance 1 | Resistance 2 |
| $74,000 | $82,000 | BTC | $85,000 | $87,000 |
Unravel everything that you need for your crypto journey via ZebPay blogs. Get started today and join 6 million+ registered users on ZebPay!