
Over the last 24 hours, the price of BCH has seen a 4.95% increase, reaching $452.86. This movement contrasts with its trend over the past week, where it has experienced a 3.0% loss, declining from $460.13 to its current price. An important metric to consider is the 30-day MVRV, which currently stands at -8.1%. This indicates that investors are currently facing losses, signalling a phase of accumulation. Historically, BCH prices have corrected at MVRV levels ranging between -6% and -24%, making this period a good phase for accumulation.
At the time of writing, BCH was trading at $457.9.
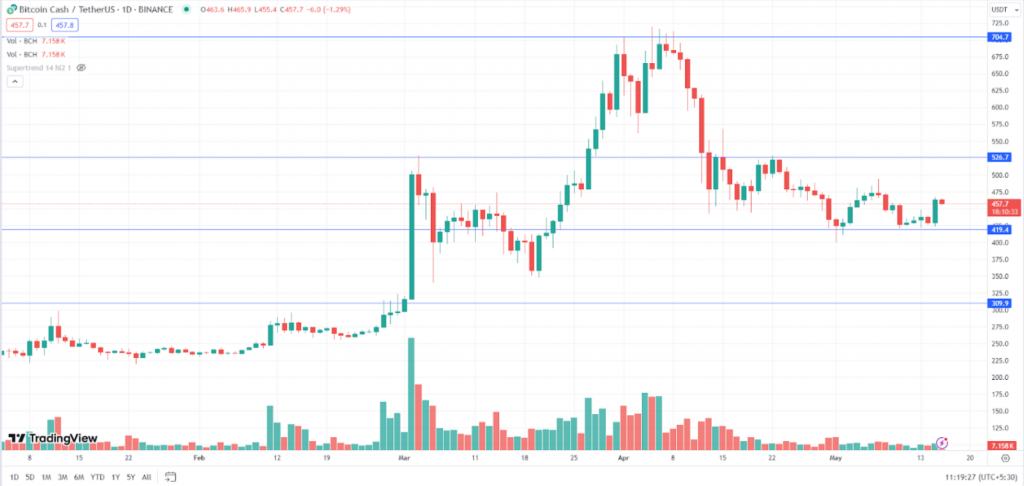
BCH after giving a breakout above the long-held resistance of $300 witnessed a sharp rally and the prices surged almost by 139% making the high of $719.5. However, the bulls failed to manage the grip on the asset as it failed to sustain and give a daily closing above $700. Post that the asset saw a sharp correction and the prices plunged by 44% and dropped to $400. After this, BCH is consolidating and trading in a range from $420 to $530 with low volumes. Breakout on either side of the range with good volumes will further decide the trend for the asset.
Key Levels:
| Support 2 | Support 1 | Asset | Resistance 1 | Resistance 2 |
| $348 | $400 | AGLD | $530 | $700 |