
Bitcoin continues to trade above the 200-day simple moving average ($84,359), signaling that bulls are maintaining steady buying pressure. This increases the likelihood of an upward breakout, potentially marking the end of its corrective phase. A positive sign for bulls is the renewed inflows into US spot Bitcoin exchange-traded funds (ETFs). Since March 14, these ETFs have accumulated $525 million, reflecting growing investor confidence. While Bitcoin faces resistance at the 200-day SMA, buyers are holding firm, indicating they expect a breakout rather than rushing to exit their positions.
BTC-USDT Daily Chart:
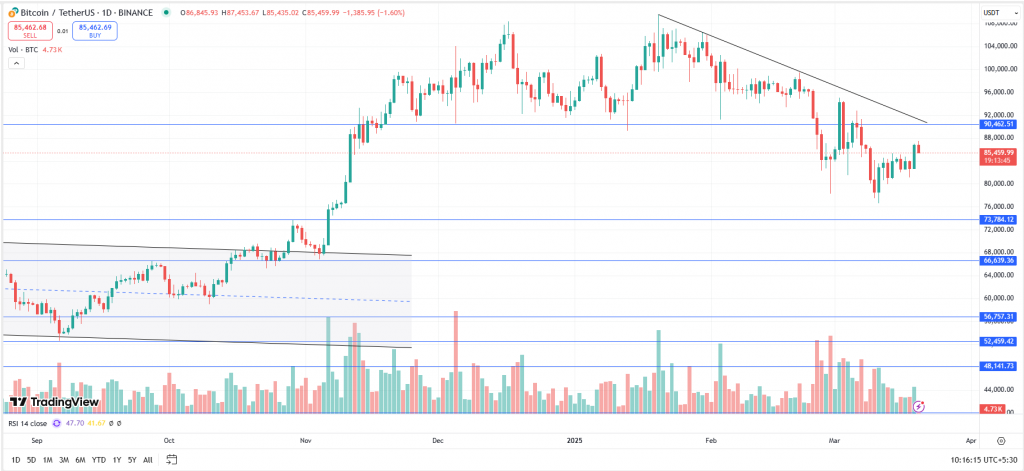
After reaching an all-time high of $109,588, BTC started trading within a ‘Descending Triangle’ pattern, finding strong support at $90,000. The asset eventually broke below the pattern, leading to a price drop to $78,258. BTC then formed a ‘Hammer’ candle, triggering a relief rally up to $95,000. However, bulls lost momentum, and the price corrected to $76,606. Key support levels now stand at $80,000 and $73,500, while $90,000 and $100,000 will serve as strong resistance zones.
In the grand scheme of things, ZebPay blogs are here to provide you with crypto wisdom—get started today and join 6 million+ registered users to explore endless features on ZebPay!