
Here is a technical analysis of ETH/USDT on a daily timeframe:
Overall Market Trend
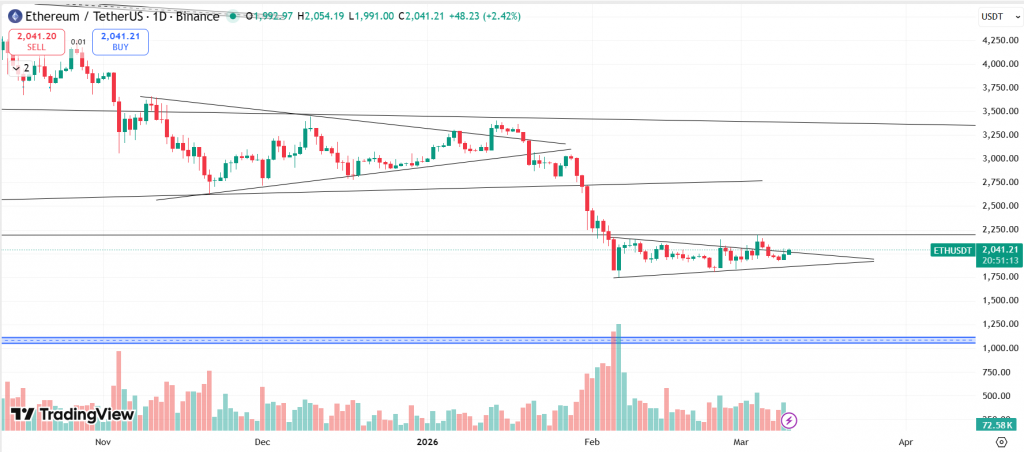
On the daily chart, Ethereum is still in a downtrend. A few months ago, ETH was trading close to $4,900, but it has fallen to around $2,000. This means the price has dropped by more than 55–60% from the top. When we look at the chart, ETH is still making lower highs and lower lows, which is a clear sign that sellers are still stronger than buyers. Until the price starts making higher highs again, the overall trend should still be considered bearish.
Also Read: Introducing Rebalancing for CryptoPacks
Price Analysis
After a big fall in early February, ETH stopped dropping and started moving in a small sideways range. Right now, the price is moving inside a symmetrical triangle pattern between $1,800 and $2,100. This usually means the market is taking a pause and deciding the next direction. Some important things to notice:
- Price movement has become slower
- Candles are getting smaller
- Volume is lower than before
This shows that buyers and sellers are both waiting for the next move.
Volume Activity
When ETH dropped in February, trading volume increased significantly. This means many people were selling at that time. After the drop:
- Volume has decreased
- There is no strong buying yet
This usually happens when the market is cooling down after a big move.
Important Resistance Levels
- $2,100 (First Resistance): This is the upper line of the triangle. If ETH breaks above this level, the price could move higher.
- $2,200 (Strong Resistance): Earlier, this level was support, but after the breakdown, it has become resistance. Sellers may appear here again.
- $2,700 – $2,800 (Major Resistance): This is a very strong level on the chart. If ETH ever moves above this area, the trend could start turning bullish again.
Important Support Levels
- $1,800 (Immediate Support): ETH has bounced from this level a few times recently.
- $1,600 – $1,700 (Next Support Zone): If $1,800 breaks, the price may drop to this area.
- $1,100 – $1,200 (Major Long-Term Support): This is a very strong historical support level where buyers have entered in the past.
Possible Next Moves
Since ETH is inside a triangle, the next big move will likely happen only after a breakout with high volume:
- If ETH breaks above $2,100, price could move towards $2,200 – $2,400
- If ETH breaks below $1,800, price could drop towards $1,700 – $1,500
Simple Market View
- Short-term: Neutral (moving sideways)
- Medium-term: Bearish (trend is still down)
Right now, ETH is not clearly bullish yet. It is just consolidating after a big drop. For the market to become bullish again, ETH needs to break and stay above $2,200–$2,400 with strong buying volume.
Also Read: FiDEX 2026: Growing Role of Crypto in Modern Investing
At the time of writing, ETH was trading at $2,041.
Key Levels
| Support 2 | Support 1 | Asset | Resistance 1 | Resistance 2 |
| $1,500 | $1,800 | ETH | $2,200 | $2,800 |
Summary: Ethereum is currently trading in a post-decline consolidation phase within a symmetrical triangle between $1,800 and $2,100. The broader market structure remains bearish, and the lack of strong buying volume suggests that the market has not yet transitioned into an accumulation or recovery phase. A decisive breakout from this compression zone will likely determine ETH’s next directional move in the coming weeks. Until then, the market remains in volatility contraction, with downside risk still dominant unless key resistance levels are reclaimed.
In the grand scheme of things, ZebPay blogs are here to provide you with crypto wisdom. Get started today and join 6 million+ registered users to explore endless features on ZebPay!