



Here is a technical analysis of ETH/USDT on the daily timeframe:
Market Overview
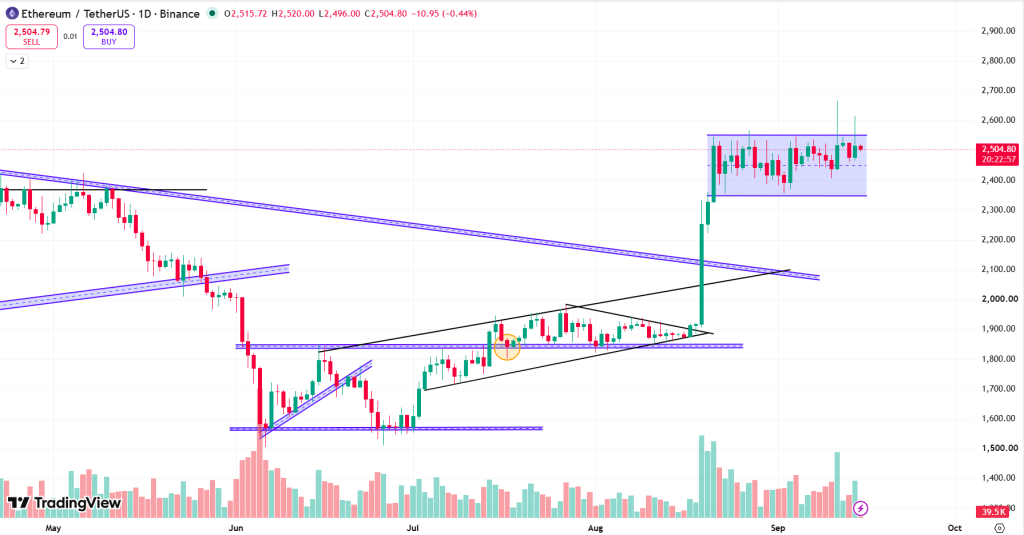
ETH continues to maintain a bullish medium-term structure on the daily chart. After establishing a major bottom around $1,550-$1,600, ETH gradually recovered, reclaimed the $1,850-$1,900 region, and subsequently broke out strongly toward the $2,500-$2,650 area. The most important development since the previous report is that ETH has continued to hold above $2,300-$2,350 despite several attempts to move lower.
Price is now consolidating between approximately $2,350 and $2,550, while repeated upper wicks indicate strong selling pressure around the $2,550-$2,650 region. The large-volume breakout from the $1,900 area remains the primary bullish signal. However, ETH has now spent several weeks below the major resistance zone, meaning the market is waiting for a decisive breakout before the next major leg higher.
Technical Analysis
The daily chart shows a clear sequence:
- Major Bottom: Approximately $1,550-$1,600
- Recovery: ETH reclaimed $1,700-$1,800
- Major Breakout: ETH broke above $1,850-$1,900
- Impulsive Move: Strong rally toward $2,500-$2,650
- Current Consolidation: Approximately $2,350-$2,550
- Current Price: Approximately $2,505
- Major Resistance: $2,550-$2,650
- Major Support: $2,350-$2,400
Also Read: L&T Enters India’s Tokenized Bond Market
The consolidation following the large breakout can still be interpreted as a bullish continuation structure. Importantly, the volume profile supports the bullish interpretation. The strongest volume occurred during the breakout from the $1,900 region, while price subsequently entered a relatively tighter range. This suggests that the market has not yet experienced a major distribution breakdown. However, ETH is now approaching the upper boundary of its range, so the next breakout attempt is particularly important.
At the time of writing, ETH was trading at approximately $2,504.
Summary
ETH remains bullish on the daily timeframe, but it is currently consolidating below major resistance. The chart shows a strong bullish impulse from approximately $1,850-$1,900 toward $2,500-$2,650, followed by sideways consolidation between approximately $2,350 and $2,550. The most important level is now $2,550-$2,650. A confirmed daily breakout above this region with strong volume could initiate the next major move toward $2,700, $2,800-$2,850, and eventually $3,000. A sustained continuation above $3,000 could open the possibility of $3,100-$3,250. On the downside, $2,350-$2,400 is the key support zone. Losing this region would weaken the bullish setup and could lead toward $2,200-$2,250 and then $2,100-$2,150. For now, the structure remains bullish above $2,350, with the market waiting for a decisive breakout above $2,600.
Support and Resistance Levels
| Support 2 | Support 1 | Asset | Resistance 1 | Resistance 2 |
| $2,150 | $2,350 | ETH | $2,600 | $2,800 |
In the grand scheme of things, ZebPay blogs are here to provide you with crypto wisdom. Get started today and join 6 million+ registered users to explore endless features on ZebPay!