
Ether is currently experiencing a notable price breakout, propelled by a surge in institutional interest. Over the past 30 days, the increased bullish sentiment has driven Ether’s price up by an impressive 26.2%. The significant development of ETH trading consistently above the $2,000 mark suggests a shifting focus towards Ether, and this renewed bullish momentum has led to an impressive 69.5% year-to-date gain. As sentiment and volatility continue to rise for Ether, there is a visible trend of whales steadily accumulating more.
At the time of writing, ETH was trading at $2,010.
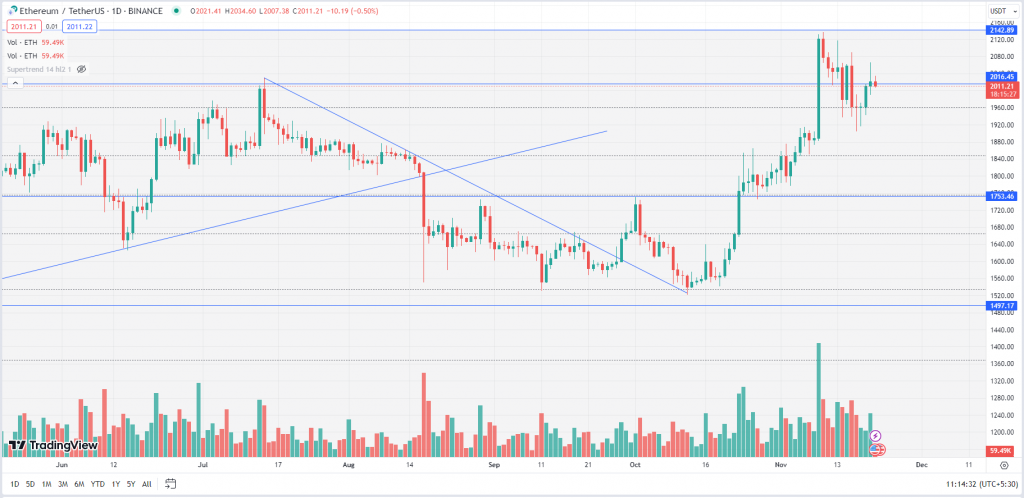
ETH after taking multiple supports at the key level of $1,530 (78.6% Fibonacci Retracement Level) started moving up by forming a ‘Higher High Higher Low’ pattern. The asset broke the long-held resistance of $1,750 and surged up to $2,136. However, the bulls failed to break the previous high of $2,146 and the prices witnessed some profit booking and corrected almost by 10% to $1,904. ETH made a double ‘Doji’ at the recent low of $1,904 and rallied up to $2,066. Currently, the prices are hovering around $2,000. To further rally it needs to break, close and sustain above $2,150.
Key Levels:
| Support 2 | Support 1 | Asset | Resistance 1 | Resistance 2 |
| $1,750 | $1,950 | ETH | $2,150 | $2,400 |