
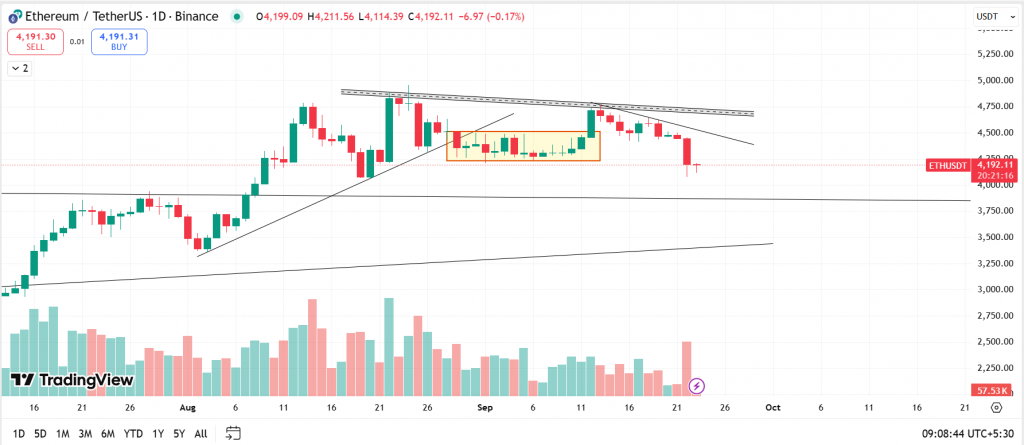
This ETH-USDT daily chart displays key technical signals that suggest caution and potential bearish pressure in Ethereum’s price action as of September 23, 2025.
Major Observations
- ETH-USDT is trading around 4,192 USDT, notably below a descending resistance trendline that has contained price since late August, suggesting sustained selling pressure.
- There is a visible breakdown from a rectangle consolidation zone (yellow box) that formed in early September, confirming distribution after a failed bullish attempt.
- The breakdown is accompanied by a surge in red volume bars, indicating aggressive selling and increased participation by bears.
Technical Support & Resistance
- Immediate resistance: 4,400–4,500 USDT, marked by the descending trendline connecting recent lower highs and the rectangle top.
- Key support: The 3,800 USDT area is the next logical target, as marked by previous horizontal support.
Volume & Market Sentiment
- The breakdown candle is associated with a marked increase in trade volume, often indicative of panic selling or institutional profit-taking.
- The preceding weeks showed declining volume during consolidation, a classic setup for a breakout or breakdown, which materialized to the downside.
At the time of writing, ETH was trading at $4,192.
Strategic Pointers
- Avoid long positions unless the price regains support above the broken neckline and trendlines with convincing volume.
- Consider trailing stops on existing positions; keep risk management tight due to volatility at breakdown points.
- Sideways or corrective moves are possible before testing major support; keep an eye on volume
Key Levels:
| Support 2 | Support 1 | Asset | Resistance 1 | Resistance 2 |
| $3,800 | $4,000 | ETH | $4,750 | $5,000 |
Unravel everything that you need for your crypto journey via ZebPay blogs. Get started today and join 6 million+ registered users on ZebPay!