
Ethereum (ETH) has managed to hold above the breakout level of $1,746, but the bulls have faced difficulties in extending the recovery. This implies that demand weakens at higher levels. The fact that the moving averages are rising and the relative strength index (RSI) is in overbought territory suggests that the bulls currently have the upper hand. The upcoming meeting of the Federal Open Market Committee on November 1st could introduce some volatility, but it is anticipated to be short-lived since no major surprises are expected.
At the time of writing, ETH was trading at $1,802.
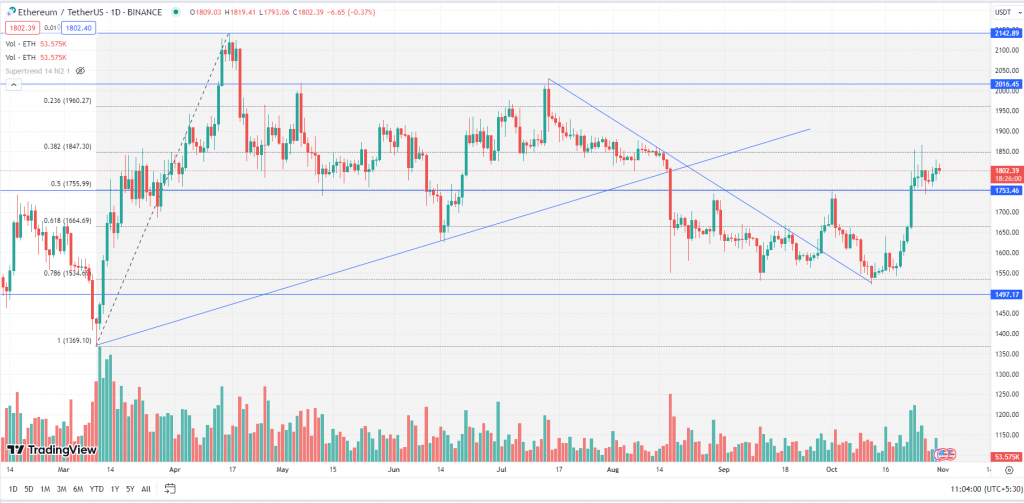
ETH after taking multiple supports at the key level of $1,530 (78.6% Fibonacci Retracement Level) started moving up by forming a ‘Higher High Higher Low’ pattern. The asset broke the long-held resistance of $1,750 and rallied up to $1,865. Currently, ETH is consolidating between $1,770 to $1,815. The asset has a strong resistance zone from $1,950 to $2,000 whereas $1,750 will act as a strong support.
Key Levels:
| Support 2 | Support 1 | Asset | Resistance 1 | Resistance 2 |
| $1,525 | $1,750 | ETH | $1,950 | $2,150 |