MACRO ASPECTS
Markets were choppy last week, with stocks swinging sharply before finally finding their footing by Friday. The VIX pushed above its 200-day trend line — a hint that the unusually calm risk backdrop we’ve been accustomed to may be slipping. Crypto softened, and the private credit world also felt the pinch as credit protection costs rose sharply for companies tied to the AI build-out. Debt investors are now questioning whether hyperscalers can keep up with the aggressive spending required to fuel AI expansion.
The main driver behind this shift was the Federal Reserve tempering expectations around a December rate cut. Early in the week, traders were betting heavily on a cut, but after firmer Fed messaging about sticky inflation and job-market resilience, those odds were almost cut in half. Short-term yields pushed higher, and funding markets tightened noticeably — SOFR spreads widened to 15 bps over IORB, signaling that cash is getting pricier and liquidity is being withdrawn.
Those liquidity pressures are now spilling into risk assets across the board — hurting momentum stocks, crypto, and corporate credit simultaneously.
MOMENTUM OF EQUITIES
Stocks closed the week mixed, with the S&P 500 managing a small advance despite several sharp intraday drops. Beneath that headline performance, however, cracks are widening. Market breadth continues to weaken: the megacap AI leaders — which have driven most of 2025’s equity performance — actually lagged the broader market, showing that their once-dominant momentum is cooling. Since late October, the performance gap between tech titans and the rest of the index has finally started to narrow.
Thursday’s decline was a good example of the fragility: high-momentum names sold off aggressively, retail-favored stocks slumped, and even heavily shorted names — which typically benefit from forced covering — tumbled. Funding stress is clearly tightening the screws on speculative corners of the market.
With repo rates pushing above the interest paid on bank reserves, the amount of available system liquidity keeps shrinking. That’s a major shift: the liquidity wave that helped keep valuations buoyant is receding, and now equity pricing is far more sensitive to any rise in real yields or downgrade in earnings expectations. The VIX jump confirms it — investors are waking up to risk again.
Overview for Crypto Market:
Crypto continues to trade like a pure barometer of global liquidity — and liquidity is tightening. Funding stress intensified through the week as SOFR spreads widened and Treasury supply absorbed cash, pressuring all high-beta risk assets. Earlier in the year, crypto weakness was driven mostly by large “OG” holders distributing into strength. That dynamic has now shifted. The latest drop below $100K in Bitcoin was dominated by short sellers and ETF outflows, not long-term investors reducing exposure. Strategy (formerly MicroStrategy) even traded below its implied Bitcoin NAV, drawing traditional finance short-interest into both MSTR and BTC.
The good news? Big holders appear to be slowing their sales. Wallets holding 1,000+ BTC have begun increasing again — a sign that larger allocators are opportunistically accumulating into weakness. Meanwhile, options markets remain defensive, with skew elevated as traders continue paying up for downside protection. Ethereum has followed a similar pattern, with long-term holders actively selling into demand from ETFs and index rebalancing — helping stabilize prices but limiting upside. Across the board, crypto is still feeling the liquidity squeeze. But the composition of sellers is shifting in a constructive direction.
BTC Technical
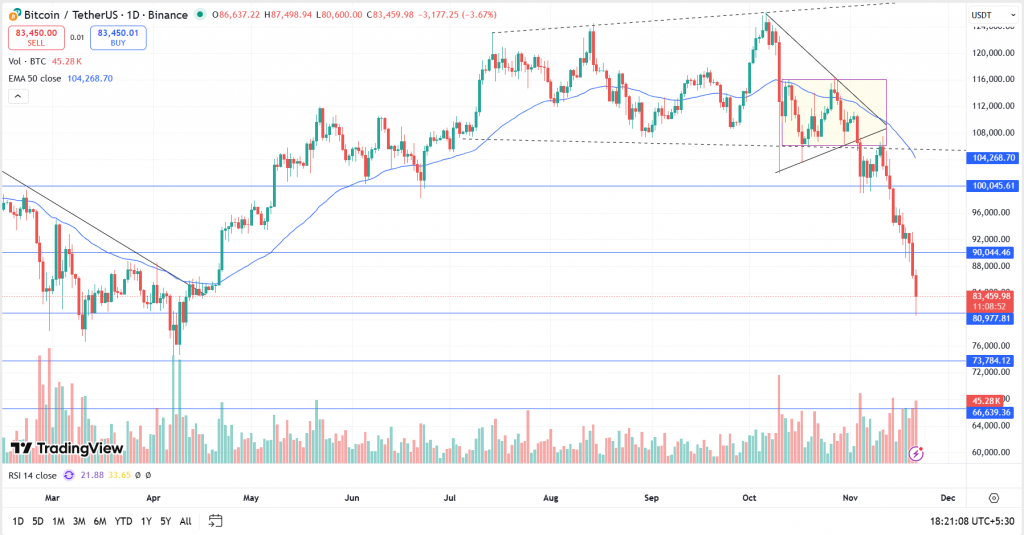
BTC, after making a new all-time high of $126,199, witnessed a sharp fall and the price plunged almost 20% to $102,000. Post this move, the asset was trading in a range between $116,000 and $107,000, forming a Symmetrical Triangle Pattern. BTC gave a breakout below the range and plunged another 25%, making a low of $80,600. The asset has strong support at $80,000. If it holds and sustains above this level, we may expect a relief rally toward $90K. If the price breaks and closes below the support, further downside could follow, with the next support around $73,000.
Ethereum Technical
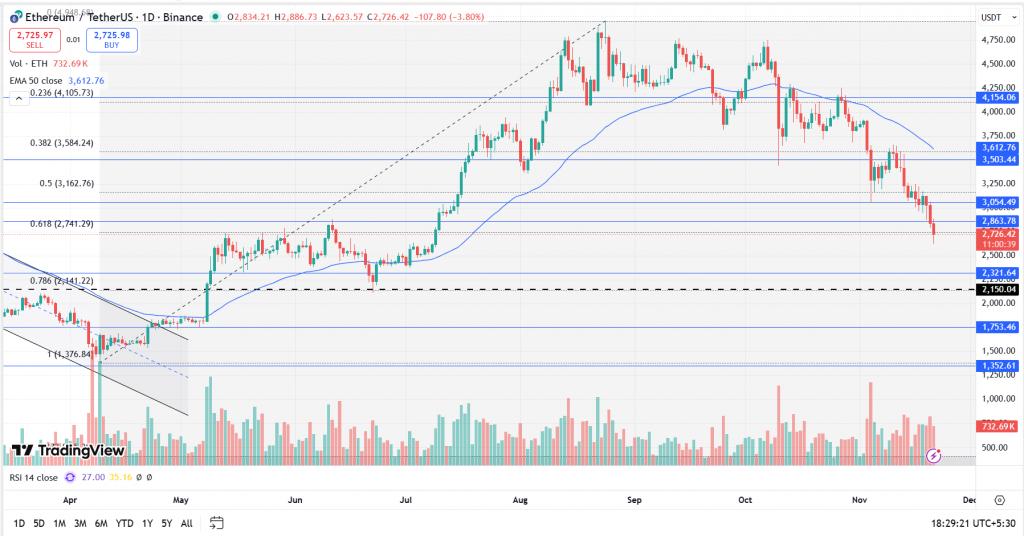
ETH, after making a new all-time high of $4,956, witnessed a sharp fall as the price plunged almost 39% to $3,054. The asset attempted to take support at the psychological level of $3K and started consolidating in a range. ETH eventually gave a breakout below the range, and the price made a recent low of $2,623. The asset has support at $2,740 (61.8% Fibonacci Retracement Level). If it holds and sustains above this support, we may expect a relief rally toward $3,000. However, if it closes below the support, it may test the next support zone at $2,500 to $2,350.
Conclusion:
Crypto’s selloff since October has been painful — but also cleansing. Much of the speculative leverage has washed out, and large legacy sellers are no longer driving price action. The market is now more responsive to macro liquidity conditions than forced liquidation flows.
As a result:
- Beta to Nasdaq is rising
- Tail-risk hedging looks expensive
- Any easing in liquidity could trigger rapid short covering
Put simply, downside asymmetry is fading. While the macro backdrop remains tight, positioning and flows now lean toward stability over capitulation. From here, even marginal improvements in risk appetite may have a more positive impact than in recent months.
Unravel everything that you need for your crypto journey via ZebPay blogs. Get started today and join 6 million+ registered users on ZebPay!