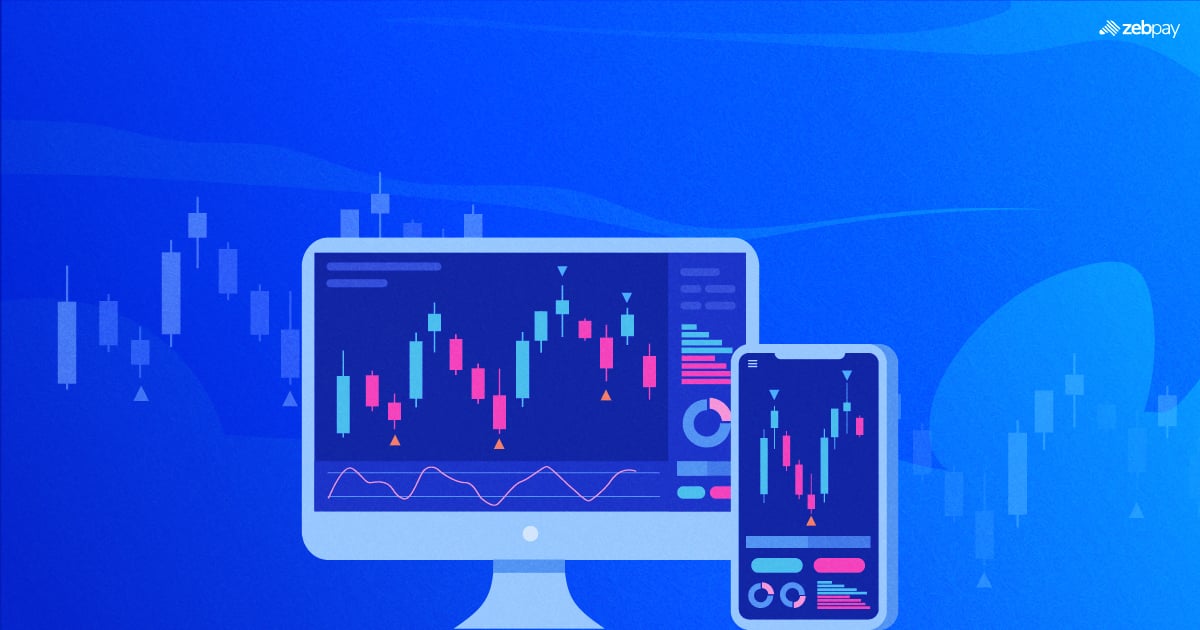
Candlestick patterns visually illustrate daily price movement data. Unlike traditional open-high, low-close bars, candlestick charts are a distinct form of financial chart used to depict patterns in the price movements of derivatives, securities, cryptos and currencies. While resembling bar charts, candlesticks are more compact and consolidate data from various time frames into a single candlestick bar. This article will provide an overview of candlestick patterns, including common patterns, examples, and guidance on interpreting them.
What are the Basics of Candlestick Patterns?
Candlestick patterns comprise three fundamental components: the body, representing the open-to-close range. The wick or shadow indicates the high and low of a certain time frame, and the color signifies the market movement direction. A green (or white) body signifies a price increase, while a red (or black) body indicates a price decrease. Candlesticks are formed by fluctuations in price, and although these movements may seem sporadic, they often configure patterns that traders analyze or use for trading strategies.
These patterns are broadly categorized as bullish or bearish. Bullish patterns suggest a likely price increase, while bearish patterns suggest a probable price decrease. It’s important to note that no pattern is foolproof, as candlestick patterns depict tendencies in price movement rather than providing guarantees.
Read more: How To Read Crypto Trend Analysis & Buying Pattern Chart
What are Some Common Candlestick Patterns?
Doji
The Doji candlestick is characterized by an extremely small body and a long shadow. Although it is commonly seen as a pattern indicating the continuation of a trend, traders need to exercise caution as it can also serve as a potential reversal signal. To prevent misinterpretation, it is advisable to open a position a few candles after a Doji when the market conditions become more evident.
Hammer
The hammer candlestick consists of a brief body and an elongated lower shadow, earning its name due to its resemblance to an upright hammer. Typically, the hammer appears after a downtrend. This pattern signifies that bulls have countered the prevailing selling pressure within a specific timeframe, successfully driving the price upward. Although hammer patterns can manifest with either green or red candles, the former suggests a more robust uptrend compared to red hammers.
Shooting Star
The shooting star is the opposite of an inverted hammer, characterized by a red candle featuring a concise body and an extensive upper shadow. Typically, there is a slight upward movement in the market at the opening of the candlestick, followed by a surge to a local peak before closing just below the open. In some instances, the body of the candlestick may be nearly nonexistent.
Engulfing Patterns
The bullish engulfing pattern is composed of two candlesticks, where the first one has a short red body and is overshadowed by a larger green candle. Despite the second candle opening lower than the preceding red one, intensified buying pressure occurs, resulting in a reversal of the downtrend.
Conversely, the bearish engulfing pattern is the opposite of the bullish engulfing, featuring a small green-bodied candle completely covered by the subsequent long red candle. This pattern emerges at the apex of an uptrend, signaling a reversal. The greater the downward continuation of the second candle, the more significant the momentum of the bearish move.
How to Read Candlestick Patterns?
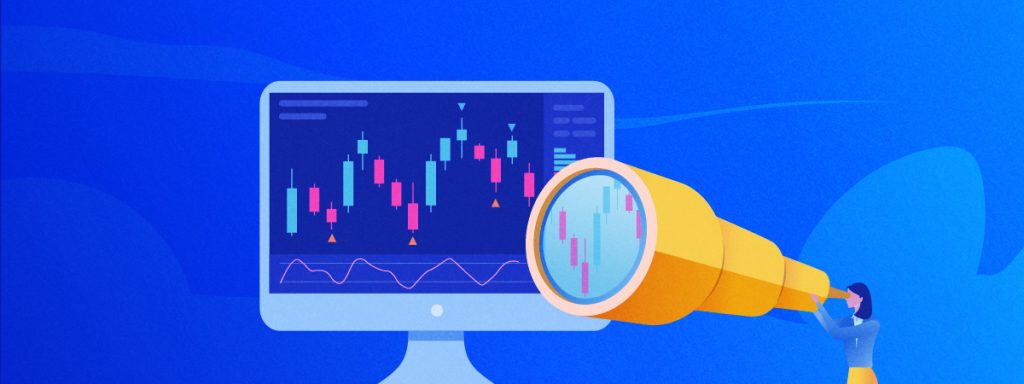
Candlestick charts provide a wealth of information regarding historical price data and become easier to interpret with practice. In addition to the discussed candlestick patterns, there are formations created by multiple candlesticks arranged in specific ways, such as double tops and double bottoms, flags, and pennants, among others.
A candle consists of a rectangular body representing the open and close prices for the day and wicks or shadows indicating the highest and lowest prices during the trading period. The color of the candle aids in identifying the market direction. Wicks highlights extremes in prices for a given trading period, offering insight into market momentum. The range is determined by the highest and lowest points of the candle, with the wicks’ highest and lowest points representing resistance and support levels, respectively.
Challenges in Interpreting Candlestick Patterns
Perplexity in Complex Patterns
Analyzing candlestick patterns can be subjective, introducing the possibility of misinterpretations among crypto traders. The same candlestick pattern may appear well-formed in one timeframe but could present a contrasting image in another. This discrepancy makes it challenging to rely on the signal conveyed by a candlestick pattern, especially when utilizing multiple timeframes. Consequently, traders may experience uncertainty when making decisions and executing trades.
Read more: Crypto Trading Strategies
Burst in Market Movements
Unexpected price swings in crypto markets can generate misleading signals from patterns.
Conclusion
Candlestick charts are an excellent instrument for understanding investor sentiment and the interplay between supply and demand dynamics. These distinctive patterns encapsulate price changes over various time intervals in each candle, illustrating the opening, closing, high, and low prices within a day. Crypto traders must recognize and analyze significant candlestick patterns to effectively monitor asset price fluctuations and leverage potential opportunities.
Read more: How to Learn Technical Analysis
If you found this blog to be useful, do share it with other like-minded crypto enthusiasts. Click on the button below to begin your crypto trading journey using ZebPay.