
Here is a technical analysis of ETH/USDT on a daily timeframe:
Market Structure
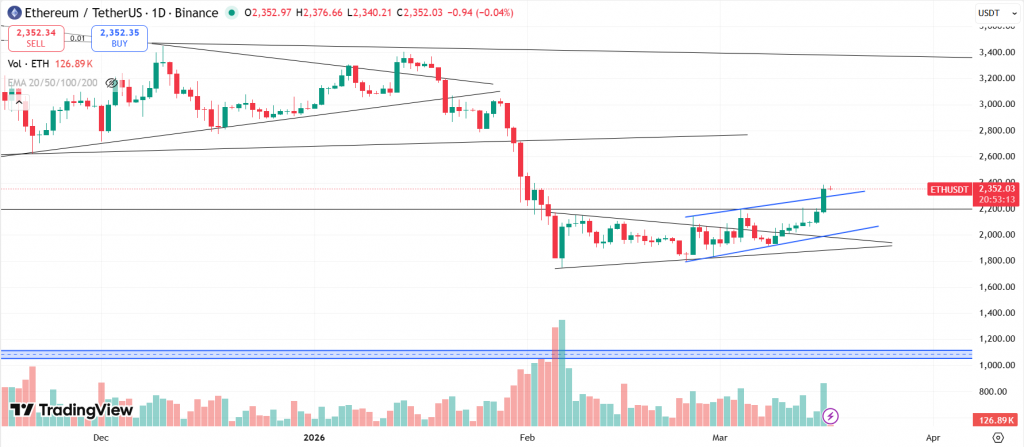
Ethereum is still in a broader downtrend, but recent price action is showing early signs of strength. After the sharp fall from 3,000 to 1,800 in February, ETH has started forming higher lows, which is the first step toward a possible trend shift. The structure is improving, but the market has not fully reversed.
Recent Price Action Shows Breakout from Consolidation
Previously, ETH was stuck inside a symmetrical triangle between $1,800 and $2,100. Now, what has changed:
- Price has broken above the triangle
- Strong bullish candles pushed the price above $2,200
- Currently trading around $2,350
This breakout shows that buyers have stepped in, at least in the short term. Also, the price is now moving within a rising channel (uptrend channel), which indicates controlled upward movement rather than a random spike.
Volume Is Supportive but Not Strong
Volume increased during the breakout. However, it is still not very strong compared to the February sell-off. This means:
- Buying is present
- But not strong enough yet to confirm a full trend reversal
So, this looks more like a relief rally rather than a confirmed bull run.
Also Read: Pi Network Price Prediction
Resistance Levels – Where Price Can Struggle
- $2,350 – $2,400 (Current Zone) [Price is already reacting here. This is a short-term resistance]
- $2,700 – $2,800 (Major Resistance) [This is a very important level. ETH faced heavy selling here before. If the price reaches this zone, expect strong resistance again]
Trendline Resistance (Higher Timeframe) [There is also a descending trendline above the price, which has not yet been broken. This keeps the larger trend bearish]
Support Levels – Key Areas to Watch
- $2,200 – First Support [Previous resistance is now acting as support after the breakout]
- $2,000 – Psychological Support [If the price drops below $2,200, this level becomes important]
- $1,800 – Strong Support [If ETH falls back to this level, it would indicate that the breakout has failed]
Also Read: Can I Use Crypto to Invest in Real Estate?
What This Move Actually Means (Important Reality Check)
Right now, many people may think that the trend has reversed and a bull run has started. That is not correct yet. Here’s the reality:
- ETH is still below major macro resistance
- The broader trend remains bearish
- This move looks like a relief bounce after heavy selling
For a real trend reversal, ETH must:
- Break and hold above $2,700–$2,800
- Show strong and consistent volume
- Start making higher highs on the daily timeframe
Until then, this is just a short-term bullish phase within a larger downtrend. At the time of writing, ETH was trading at $2,350.
Also Read: What is Pi Network? Your Gateway to the Future of Crypto!
Summary
Ethereum was trading within a symmetrical triangle and recently broke out, now moving inside a rising channel (also known as a parallel channel). ETH has given a strong breakout, but it is not a fully bullish move until it crosses $2,750. This appears to be a relief from selling as buyers have stepped in, but it could also turn into a trap. If ETH holds above $2,200, it may move higher; however, if it falls below this level, the breakout could fail.
Key Levels
| Support 2 | Support 1 | Asset | Resistance 1 | Resistance 2 |
| $1,800 | $2,200 | ETH | $2,400 | $2,800 |
In the grand scheme of things, ZebPay blogs are here to provide you with crypto wisdom. Get started today and join 6 million+ registered users to explore endless features on ZebPay!