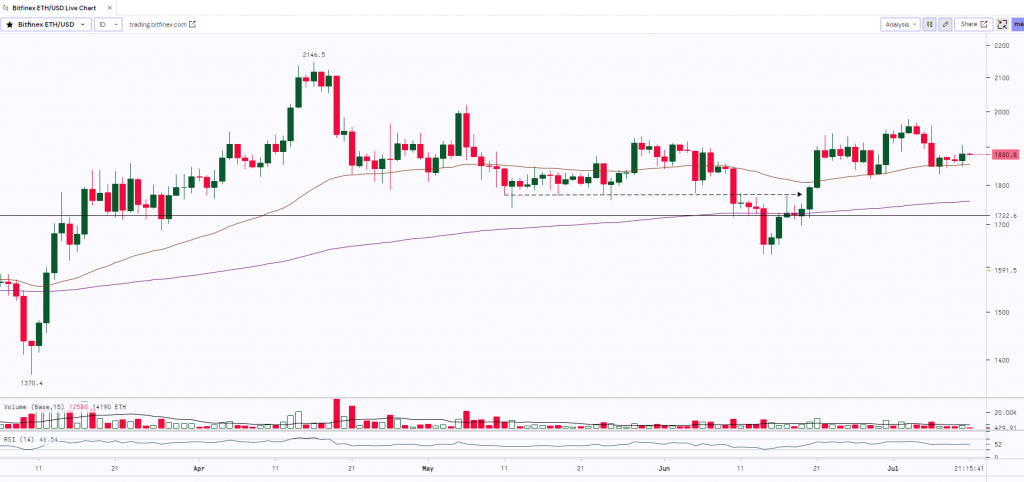
Ether is currently facing resistance at the 20-day exponential moving average ($1,871) while the bulls are attempting to defend the 50-day simple moving average ($1,841). This struggle between buyers and sellers indicates a lack of clear momentum in the market. The flattening of both moving averages and the RSI hovering around the midpoint suggests a balance between supply and demand for Ether. Despite the challenges, large investors are adopting a bullish stance and taking advantage of the relatively stagnant prices. Additionally, the weakness in the U.S. Dollar Index is seen as a positive factor for Bitcoin and altcoins like Ether in the short term.
At the time of writing, ETH was trading at $1,881.5

ETH made a ‘Bullish Harami’ pattern at the recent low of $1,628.4 (on 15th June 2023) and has surged almost by 21% up to $1,978.4. Post this move, the asset witnessed a minor correction or profit booking as the bulls failed to push the prices above the psychological level of $2k mark and the prices dropped to $1,828. Currently, ETH is trading sideways in a narrow range from $1,840 to $1,900 with low volumes. The asset has strong resistance at the psychological level of $2,000 and the previous high of $2,146. Once the asset breaks and sustains above these resistance levels then we can expect the prices to surge up to 2,400 – 2,500 levels whereas $1,800 to $1,750 will act as a strong support.
| Support 2 | Support 1 | Asset | Resistance 1 | Resistance 2 |
| $1,610 | $1,750 | ETH | $1,950 | $2,150 |


