TRX’s price was $0.075 at the beginning of August. This was nearly 20% lower than its value of $0.094 in July. Analysis of on-chain data showed that there were optimistic expectations in recent days, as the selling pressure eased. The sentiment metric, which measures the overall mood, showed a notable increase between August 6 and 7. However, it’s important to note that there was also an increase in negative funding rates during the same period. This suggests a rise in short positions, which indicates a pessimistic outlook for the crypto’s value.
At the time of writing, TRX was trading at $0.07689.
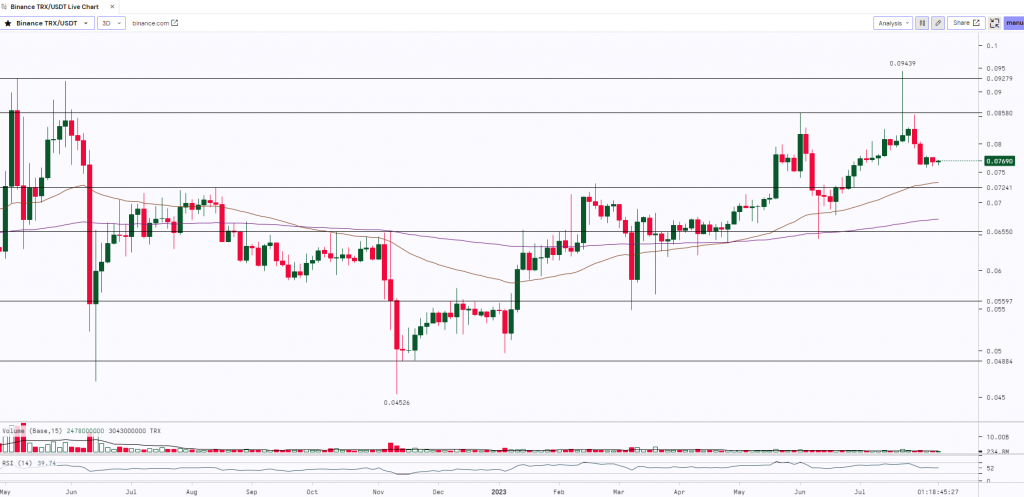
TRX made a ‘Hammer’ candle at the low of $0.06445 and witnessed a rally. The prices surged almost by 46% and made a high of $0.09439. The asset faced stiff resistance at the crucial level of $0.09280 (Previous High, Horizontal trendline) and saw a sharp profit booking and the prices dropped to $0.07576. Post this move TRX is consolidating and trading sideways in a range from $0.07579 to $0.07793 with low volumes. Breakouts on either side of the range with good volumes will further decide the trend for the asset.
Key Levels
| Support 2 | Support 1 | Asset | Resistance 1 | Resistance 2 |
| $0.07241 | $0.07575 | TRX | $0.08580 | $0.09280 |


