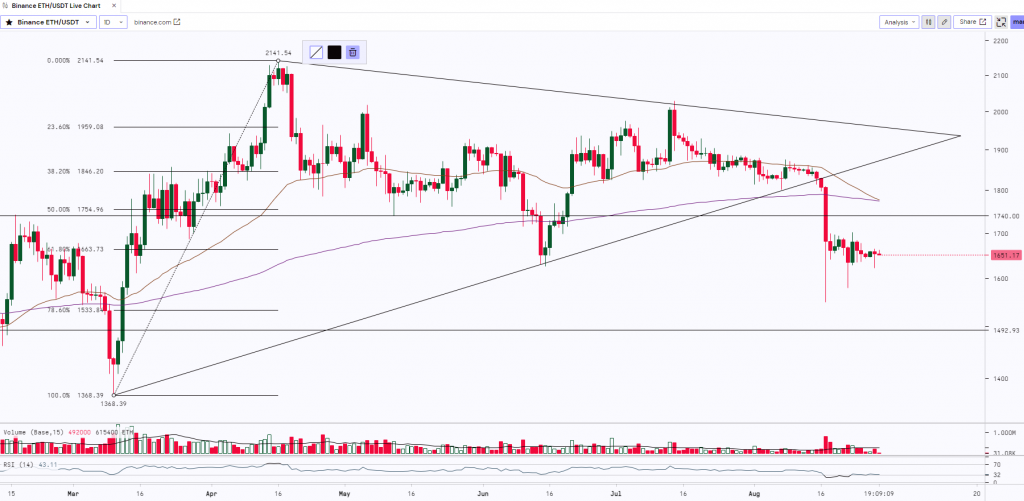
Ether’s price has been hovering around the critical support level of $1,626, indicating ongoing selling pressure from bears. The inability of the bulls to initiate a strong recovery increases the likelihood of a potential drop below the $1,626 mark. In terms of total Ethereum transaction fees, it recently hit its lowest point in eight months, reaching around 1,719 ETH, equivalent to approximately $2.1 million, on August 27th. This decline in total gas fees can be attributed to two main factors: the relatively low activity on the Ethereum network and the growing adoption of layer 2 scaling solutions.
At the time of writing, ETH was trading at $1,651.5.

ETH after making a ‘Hammer’ candle at the low of $1,368.3 witnessed a sharp rally and the prices surged up to $2,141.5. Post this move, the asset started trading in a ‘Symmetrical Triangle’ pattern where the lower uptrend line was acting as a support and the upper downtrend line was acting as a resistance. The asset then gave a breakout on the downside of the range and the prices reached a low of $1,550. Currently, the asset is consolidating and trading in a range from $1,575 to $1,700. ETH has a strong support zone from $1,535 to $1,500 (Horizontal Trendline & 78.6% Fibonacci Retracement Level) whereas $1,700 to $1,750 will act as a strong resistance zone for the asset.
Key Levels
| Support 2 | Support 1 | Asset | Resistance 1 | Resistance 2 |
| $1,350 | $1,500 | ETH | $1,750 | $2,150 |


