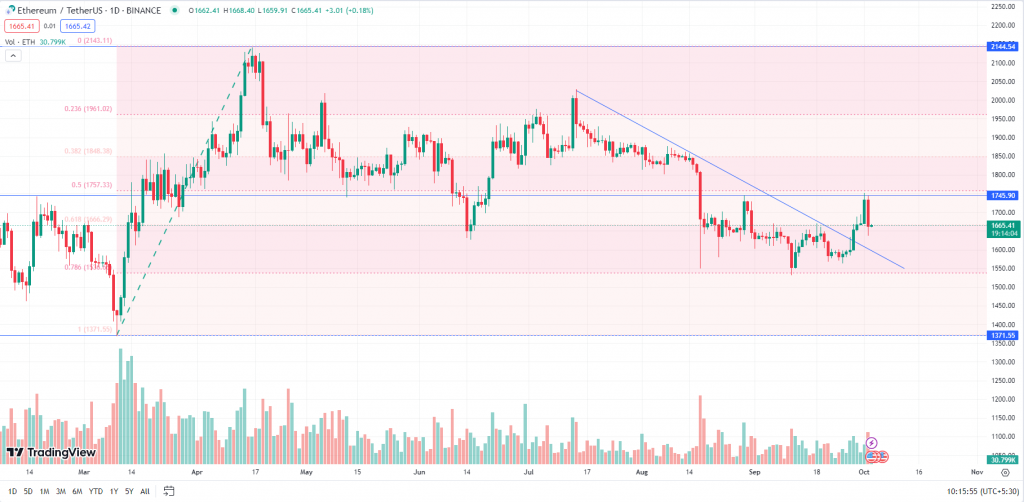
Ether made a significant move by crossing the 50-day Simple SMA of $1,652 on September 29th, followed by another substantial rally on October 1st, pushing the price towards the resistance level at $1,746. Additionally, the 20-day EMA of $1,644 has turned upwards, and the RSI is above the 64 level, indicating a dominant position for the bulls. While a short-term upward movement is possible in the crypto markets, it’s unlikely to initiate an extensive rally. The potential for profit-booking remains high near the resistance, particularly with the U.S. Dollar Index showing a strong surge, which could keep the bulls cautious.
At the time of writing, ETH was trading at $1,665.

ETH was trading sideways in a range from $1,550 to $1,650. The asset gave a breakout above the range and rallied up to $1,751. However, the bulls failed to break the long-held resistance of $1,750 (Horizontal Trendline & 50% Fibonacci Retracement Level) and witnessed some profit booking as the prices dropped to $1,636. Once ETH breaks, closes and sustains above $1,750 then it may further rally up to $1,875 to $2,000 levels. The asset has a strong support zone from $1,535 to $1,500 (78.6% Fibonacci Retracement Level & Horizontal Trendline). A break below the support may lead to further downfall.
Key Levels:
| Support 2 | Support 1 | Asset | Resistance 1 | Resistance 2 |
| $1,350 | $1,500 | ETH | $1,750 | $2,150 |


