Bitcoin Cash has faced resistance in the $220 to $230 price range despite a bullish rebound from the support level. However, recent price action and on-chart indicators suggest that buyers may be gaining the upper hand. The RSI has climbed above the neutral 50 mark and currently stands at 58, indicating increasing buying pressure. On-chain data reveals that the resilience demonstrated by long-term investors has played a significant role in BCH’s strong price performance in recent weeks. When BCH reached its 2023 peak of $329 on June 30th, only 22.5 million addresses had held their balances for up to 1 year. Despite the subsequent price correction, the number of long-term holder wallets has now increased to 23.96 million, indicating a long-term holder dominance of 96%.
At the time of writing, BCH was trading at $236.5.

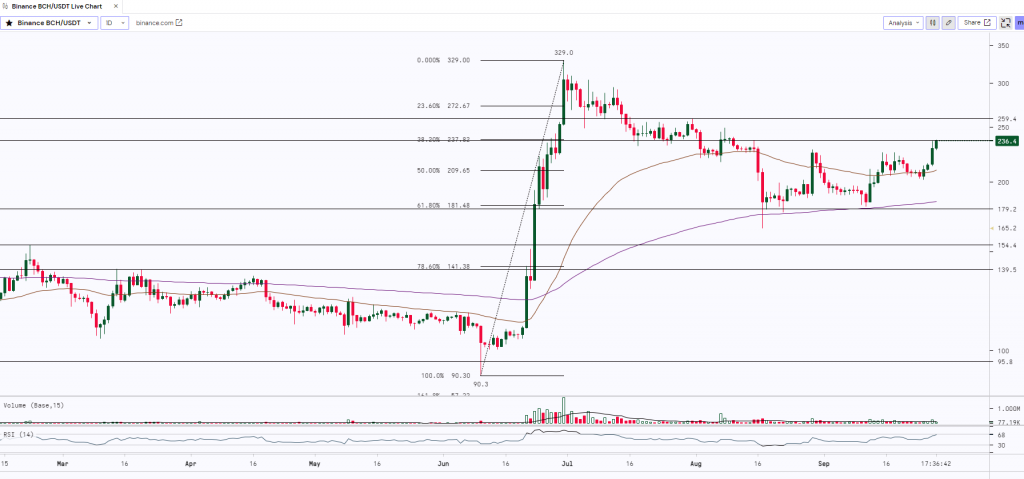
BCH witnessed a massive rally and the price surged almost by 265% from $90 up to $329. However, the asset struggled to sustain above the psychological level of $300 and failed to give a daily closing above that. Post this move, the asset saw some profit booking and the prices corrected to $165.4. BCH took multiple supports at $180 (61.8% Fibonacci Retracement Level & 200 Day Moving Average) and bounced back up to $237. The asset has strong resistance at $237 and $260. Once it breaks and sustains above the resistance level then it may further rally up to the $300 mark.
Key Levels:
| Support 2 | Support 1 | Asset | Resistance 1 | Resistance 2 |
| $180 | $200 | BCH | $237 | $260 |


