
In the past couple of weeks, Bitcoin’s price has faced challenges in maintaining a strong upward momentum, encountering significant selling pressure around the $36,000 mark. However, it’s crucial to note that the overall market trend remains bullish. The current consolidation phase might merely represent an accumulation period, laying the foundation for a revival of bullish momentum. If the price of Bitcoin breaks out above this consolidation channel, it would invalidate the immediate bearish outlook and potentially indicate the beginning of a new rally.
At the time of writing, BTC was trading at $34,940.
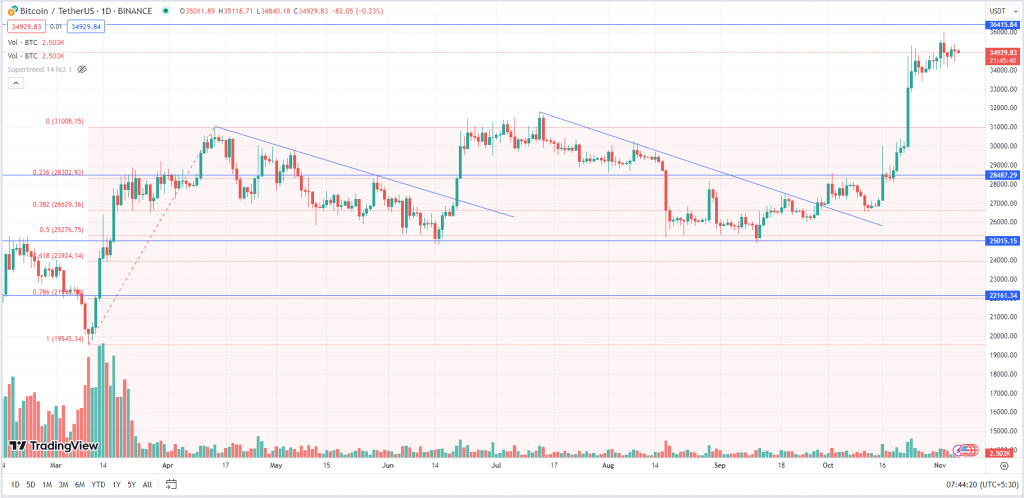
Bitcoin was trading in a range from $25,000 to $28,500 and was taking good support at the critical level of $25k (Horizontal Trendline & 50% Fibonacci Retracement Level). The asset finally gave a breakout above the range and started moving upwards. The prices broke the long-held resistance of $32,000 and rallied up to $35,984. BTC has a resistance zone from $36,000 – $36,500. If it breaks, closes and sustains above this level then we can expect it to further rally up to $40,000.
Key Levels:
| Support 2 | Support 1 | Asset | Resistance 1 | Resistance 2. |
| $28,500 | $32,500 | BTC | $36,500 | $40,000 |