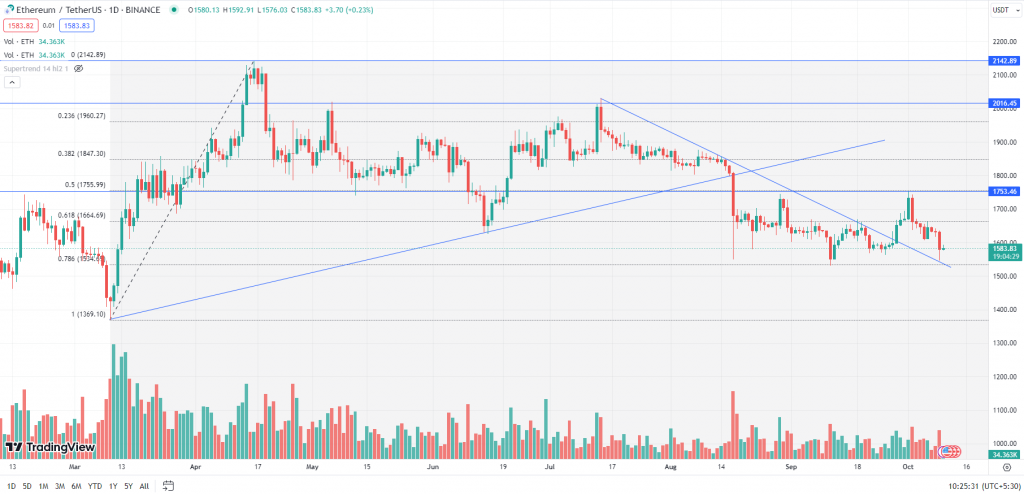
Between October 2nd and October 9th, Ethereum’s price has fallen by 8.2%. This decline can be attributed to increased coin issuance as part of Ethereum’s regular monetary policy, sales made by Vitalik Buterin (one of Ethereum’s co-founders), and a less-than-impressive performance by the newly introduced futures-based exchange-traded fund (ETF) related to Ethereum. Indeed, the recent performance of Ethereum appears to be influenced by a series of negative news and developments, contributing to a bearish sentiment in the market.
At the time of writing, ETH was trading at $1,582.

ETH last week, made a high of $1,750. However, the bulls failed to manage the grip on the asset as it faced stiff resistance at the key level of $1,750 (Horizontal Trendline & 50% Fibonacci Retracement Level). The prices witnessed a correction of almost 11.5% and dropped to $1,546. ETH has a strong support zone from $1,530 to $1,500 (Horizontal Trendline & 78.6% Fibonacci Retracement Level). On a broader time scale, the asset is trading between the range $1,750 to $1,530. Breakouts on either side of the range with good volumes will further decide the trend for the asset.
Key Levels:
| Support 2 | Support 1 | Asset | Resistance 1 | Resistance 2 |
| $1,350 | $1,500 | ETH | $1,750 | $2,150 |


