Amidst the recent market chaos, Solana (SOL) has continued to outperform, particularly during rallies. Despite being one of the most heavily shorted tokens, largely due to concerns related to FTX liquidations, SOL has demonstrated strength. It is one of the top performers in the Layer 1 blockchain space, showing a remarkable 143% increase. At present, it is testing the upper boundaries of its YTD trading range, approaching the significant psychological resistance level of $25.
At the time of writing, SOL was trading at $23.73.
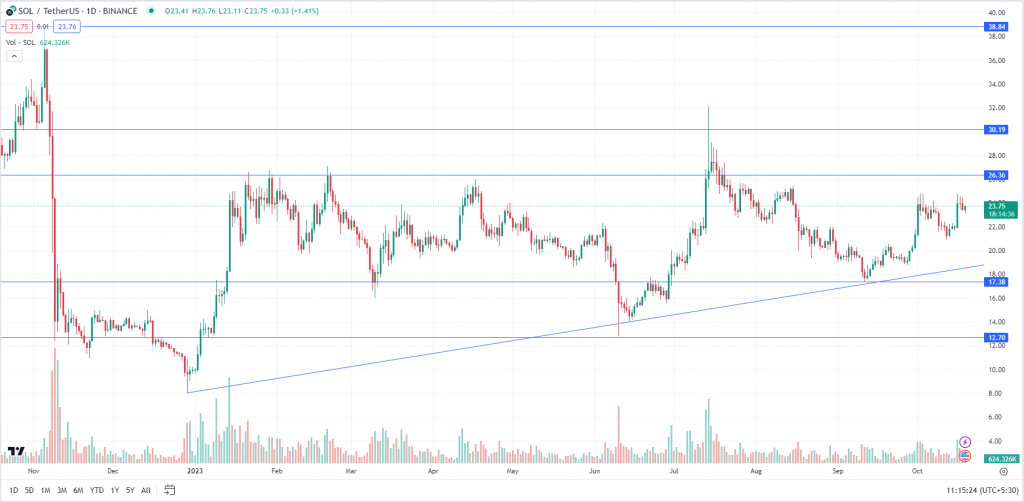
SOL has been trading in an uptrend over the past 10 months. The asset witnessed a massive rally after making a low of $8, the prices surged almost by 300% and made a high of $32. Post this move, SOL saw some profit booking and the prices dropped to $17.33. The asset took support at the uptrend line and resumed the up-move. Currently, SOL is facing stiff resistance around $25 to $26. If it breaks and closes above that it may further rally up to $30.
Key Levels:
| Support 2 | Support 1 | Asset | Resistance 1 | Resistance 2 |
| $17.5 | $20.5 | SOL | $25 | $30 |