The crypto market has been on an upward trajectory recently, with Bitcoin surging past the $63,000 mark and Ethereum edging closer to the $3,000 milestone. This surge in Ethereum’s value can be attributed to an improvement in investor sentiment, as evidenced by recent on-chain data. Ethereum’s Open Interest Ratio has notably increased, signalling a bullish sentiment among traders. Moreover, Ethereum’s Market Value to Realised Value (MVRV) ratio has decreased to 1.55 from a peak of 1.74. This decline suggests that the realized value is approaching closer to the market value, potentially presenting a buying opportunity as market sentiment stabilizes.
At the time of writing, ETH was trading at $2,948.

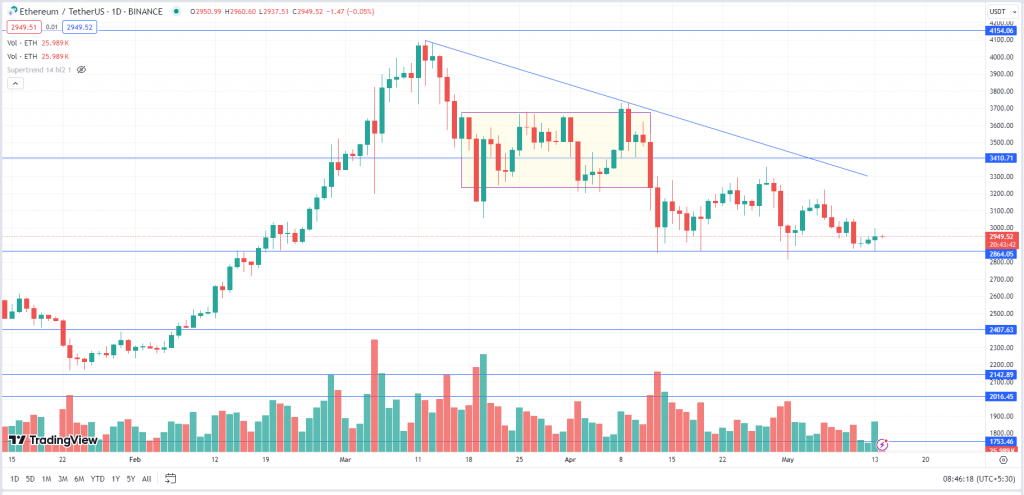
ETH after making the high of $4,093 witnessed a sharp profit booking and the prices corrected almost by 31% and dropped to $2,817. On the daily time frame, we can see that the asset is making a ‘Descending Triangle’ pattern and is taking multiple support at $2,850, and the longer lower shadow indicates buying around these levels. If the price holds and sustains above the support of $2,850 then the bulls may resume the up move whereas if it closes below $2,850 then the prices may witness further downfall. $3,000 to $3,050 will act as a strong resistance for the asset.
Key Levels:
| Support 2 | Support 1 | Asset | Resistance 1 | Resistance 2 |
| $2,600 | $2,850 | ETH | $3,050 | $3,400 |


