
On March 16, Ethereum (ETH) dipped below the 20-day Exponential Moving Average (EMA) of $3,619, signalling bearish momentum. However, the bears are facing resistance in maintaining these lower levels as bulls endeavour to reclaim ground above the 20-day EMA, aiming to thwart aggressive selling pressure. Over recent trading sessions, ETH witnessed a substantial decline, plummeting by more than 10% from its recent high of $4,000. Despite this downturn, a remarkable 89% of ETH holders remain in profit, highlighting the resilience of the network amid ongoing market volatility.
At the time of writing, ETH was trading at $3,416.
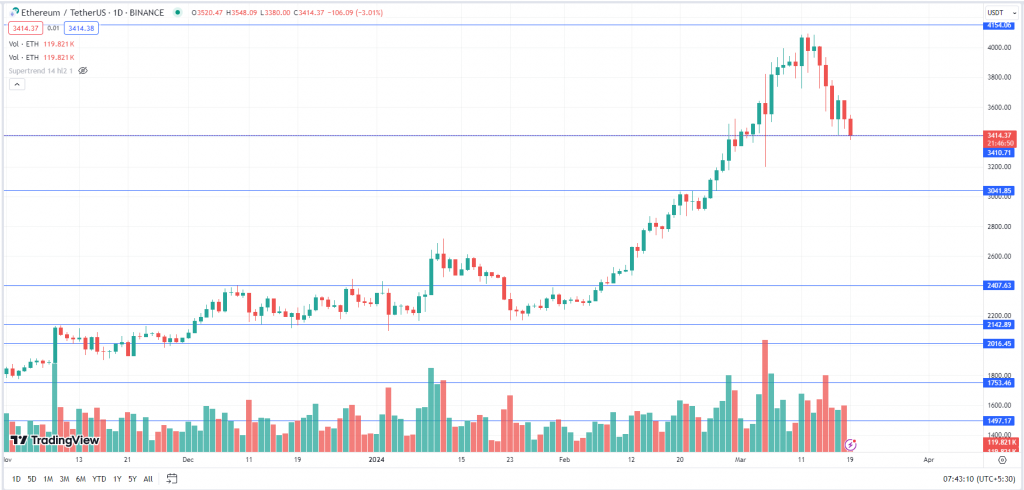
ETH after making the recent high of $4,093 witnessed a sharp correction and the prices fell almost by 17.4% making the low of $3,380. The asset has a strong support at $3,400 levels and if it holds and sustains above the support then we may expect the bulls to resume the up move. If it breaks and closes below $3,400 then the prices may test the next support level which is at $3,000. ETH will face strong resistance at $3,750 and $4,150.
Key Levels:
| Support 2 | Support 1 | Asset | Resistance 1 | Resistance 2 |
| $3,000 | $3,400 | ETH | $3,750 | $4,150 |