Despite Ethereum’s prominent position in the altcoin sector, its growth has been hindered by a prevailing bearish trend in the market in recent weeks. The 20-day EMA at $2,340 is showing a downward turn, and the RSI is in the negative zone, indicating a slight advantage for the bears. Sellers are likely to target a price decline to $2,168 and then to the robust support level at $2,150. If the price experiences a robust rebound from this support, it may result in the ETH/USDT pair remaining within the $2,150 to $2,400 range for an extended period.
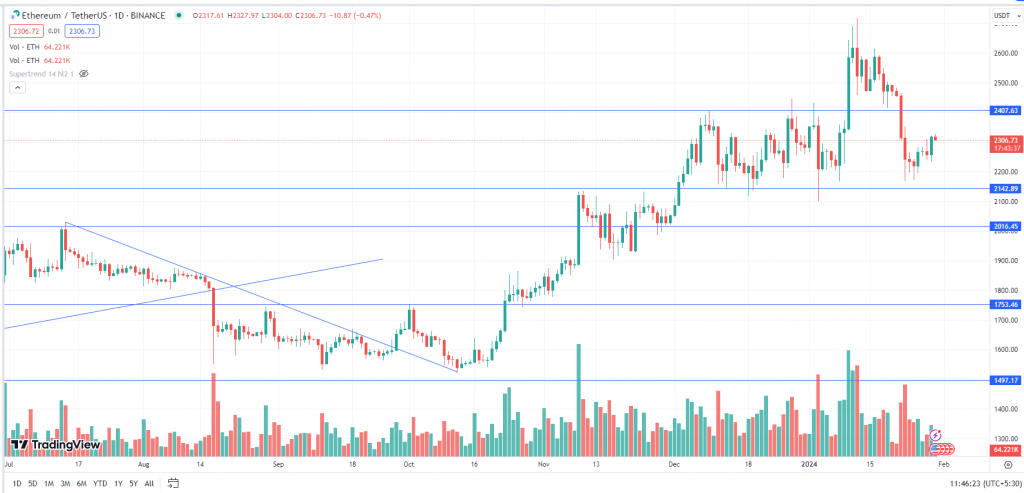
At the time of writing, ETH was trading at $2,306.7.
Ethereum (ETH) Chart
Disclaimer:Crypto products and NFTs are unregulated and can be highly risky. There may be no regulatory recourse for any loss from such transactions. Each investor must do his/her own research or seek independent advice if necessary before initiating any transactions in crypto products and NFTs. The views, thoughts, and opinions expressed in the article belong solely to the author, and not to ZebPay or the author’s employer or other groups or individuals. ZebPay shall not be held liable for any acts or omissions, or losses incurred by the investors. ZebPay has not received any compensation in cash or kind for the above article and the article is provided “as is”, with no guarantee of completeness, accuracy, timeliness or of the results obtained from the use of this information.