
Ethereum (ETH) has dropped to the strong support level of $2,850 for the second time in four days, signalling significant selling pressure from the bears. The Relative Strength Index (RSI) and the Awesome Oscillator (AO) on the daily chart support this bearish outlook, as both indicators are below their respective neutral levels of 50 and zero. This suggests that bearish momentum is likely to continue, potentially leading to a further decline in Ethereum’s price.
At the time of writing, ETH was trading at $3,060.
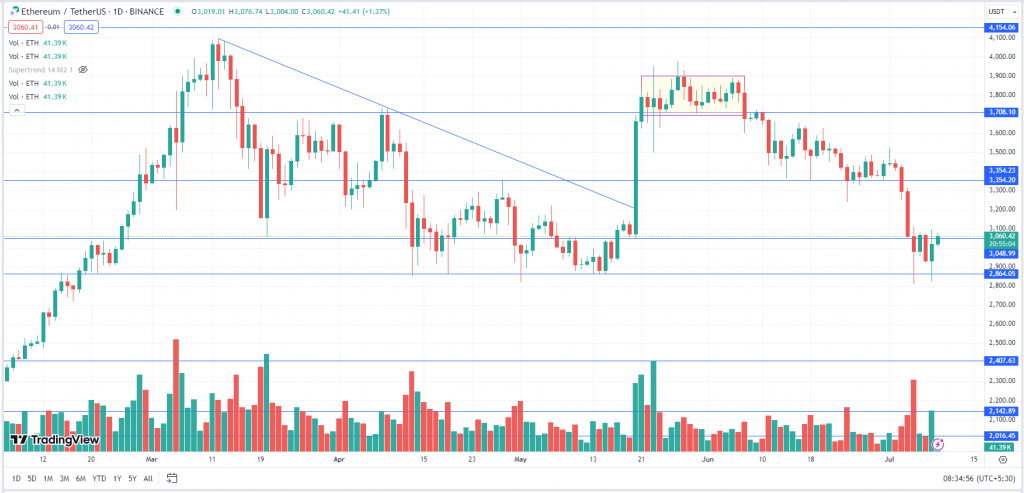
ETH after giving a breakout above the ‘Descending Triangle’ pattern rallied up to $3,977. However, the bulls failed to manage their grip on the asset as the prices didn’t cross the psychological resistance of $4,000 and started consolidating between $3,900 to $3,700. ETH gave a breakout on the downside of the range and witnessed a sharp correction. The prices dropped to $2,810. The asset has a strong support zone from $3,000 to $2,850. If it holds and sustains above these levels then we can expect the bulls to resume the up move.
| Support 2 | Support 1 | Asset | Resistance 1 | Resistance 2 |
| $2,850 | $3,000 | ETH | $3,300 | $3,700 |