
A head-and-shoulders pattern is a tool utilized in technical analysis within the crypto market. A crypto upward trend eventually turns downward. This is usually signalled by the head and shoulder patterns. It has three peaks rising from a baseline. The other two peaks are similar in height. However, the middle peak is the tallest. When you see this pattern, it signals that the upward trend is ending. A bearish trend will likely take over from bullishness soon. Now, let’s explore this concept further.
Basics of Head and Shoulder Patterns
Imagine a figure portraying the silhouette of a person’s head and shoulders. This chart pattern is called head and shoulders. In it, you’ll spot three distinct peaks. The tallest one in the center
represents the head itself. Meanwhile, the two shorter peaks flanking it depict the shoulders.
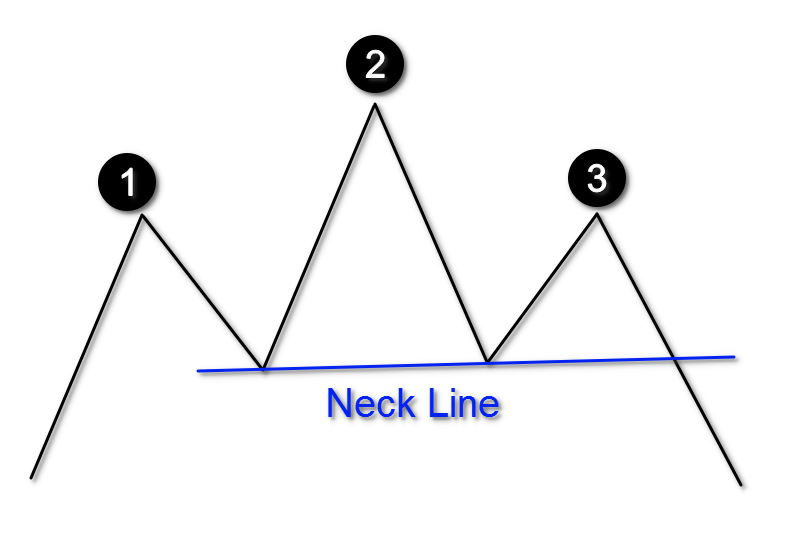
- The Left Shoulder: This is the initial segment of the pattern, formed by an upward movement in price followed by a minor correction in price.
- The Head: Positioned in the middle, the head is formed when the price rises above the previous high created by the left shoulder before declining once more.
- The Right Shoulder: This is the final peak of the pattern, resulting from another upward price movement that doesn’t reach the height of the head. Subsequently, a price decline follows.
- The Neckline: The neckline works as a strong backing for the whole pattern. If prices go below the neckline, it’s predicted to provide support. But if prices rise above it, the neckline is expected to act as resistance. So, the neckline is very important; it helps determine future price levels.
Read more: Can Chart Patterns Help with Crypto Trading
How do I Identify Head and Shoulder Formation?
An uptrend comes first when looking for the head-and-shoulders pattern on crypto charts. Traders need to spot this upward movement. The head-and-shoulders pattern usually shows up after an uptrend. It’s a sign that the trend is changing and prices may go down. So traders must carefully watch the chart’s ups and downs. They have to pay close attention to the details to catch this pattern forming.
- Identify the First Shoulder: Start by locating the initial peak, also referred to as the left shoulder. This peak should be followed by a minor price retracement, indicating a temporary pause in the upward trend.
- Observe the Head: Following the left shoulder, there should be a higher peak in price, forming the head of the pattern. The head holds significant importance as it represents the highest point attained during the uptrend, often corresponding to a period of heightened buying activity.
- Recognize the Second Shoulder: After the head, there should be another price retracement, forming the right shoulder. The second shoulder typically sits slightly lower than the left shoulder, creating a noticeable symmetry within the pattern.
- Draw the Neckline: Connect the low points of both shoulders to create the neckline. This horizontal line serves as a crucial support level and plays a pivotal role in confirming the completion of the pattern.
Read more: What is Swing Trading
Types of Head and Shoulder Patterns
Let’s delve into the two primary head and shoulder patterns.
Inverse Head and Shoulders:
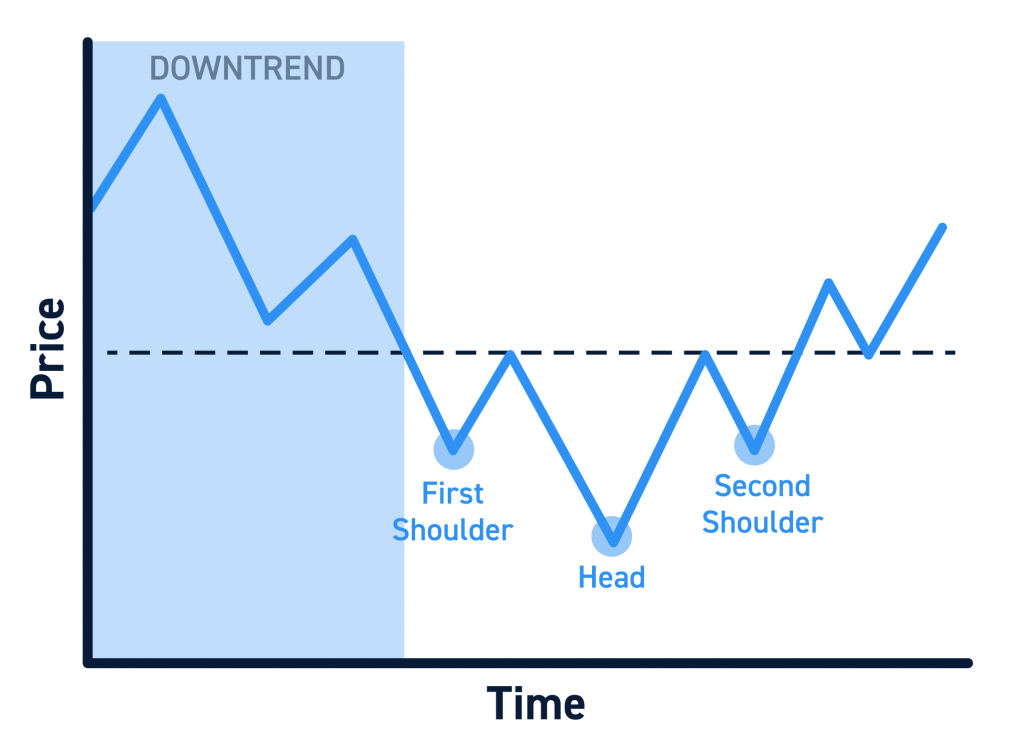
The Inverse Head and Shoulders pattern has three lows (troughs) on a chart. One low (head) is between two higher lows (shoulders). First, the price drops to a low point (the first trough). Then, the price rallies for a bit. Subsequently, a decline leads to the formation of the lower head, followed by another rally that shapes the second shoulder.
A finalized pattern occurs when the cost breaks through the “neckline” resistance. It links the two shoulder peaks. People see the inverse head and shoulders as a shift. From bearish sentiment to bullish. They expect an upward trend in the asset’s price.
Complex Head and Shoulders:
A complex head-and-shoulders pattern signals a bearish reversal. It resembles the regular head-and-shoulder formation. However, it contains multiple heads or shoulders within its structure. The Complex Head and Shoulders variation is a bearish chart pattern that offers traders valuable insights into market psychology.
This pattern usually takes more time to form than a regular head-and-shoulders pattern. It could mean the trend will shift. Crypto traders see it as a long battle between buyers and sellers, with neither side winning. Traders see it as buyers losing strength and sellers gaining power.
Read more: Long/Short Trading Strategy
How Accurate is the Head-and-Shoulders Pattern?
The head and shoulders top have been a trusted signal for potential trading reversals for a long time. This pattern’s reliability comes from requiring three tests of the same resistance level. It also requires a break in the neckline to validate the pattern. This enhances the pattern’s accuracy and dependability.
Head-and-shoulder patterns can happen in bullish and bearish markets. It’s crucial to note that this versatility offers traders an effective way to enter or exit positions based on the market’s direction. While the head-and-shoulders pattern’s accuracy is proven, remember that no technical indicator guarantees 100% success. Taking profits and cutting losses at the right time is key when using this pattern.
Read more: What is the RSI Indicator
How do I Trade the Head-and-Shoulders Pattern in Crypto?
The head-and-shoulders pattern doesn’t always conform to a perfect structure and can appear in different forms. Failure to recognize these variations could result in missed trading opportunities. However, with increased exposure to the pattern, it becomes easier to identify.
Various crypto trading strategies can be employed when utilizing the head-and-shoulders pattern.
One popular method involves waiting for a breakout below the neckline before selling. Subsequently, after the bearish breakout, crypto traders seek additional confirmations for entering trades. Traders also adopt different approaches to determine their stop-loss levels. However, when using the head and shoulders pattern, it’s advisable to place the stop-loss above the neckline. Setting the stop loss at a level that you don’t anticipate the price to reach is a sound approach.
Conclusion
Traders use crypto technical analysis and recognize patterns like the inverse head and shoulders and complex head and shoulders in their daily trading activities. Understanding the head and shoulders pattern’s rules and strategies helps them navigate the crypto markets’ complex landscape. This allows them to seize potential opportunities while also protecting their digital assets from unnecessary risks. The head-and-shoulders pattern is key to crypto trading; it shows when to enter and exit trades and how to manage risk. Yet no tool works every time, so do your homework. Do your research and make sound investment choices that fit your risk and goals.
If you found this blog to be useful, do share it with other like-minded crypto enthusiasts. Click on the button below to begin your crypto trading journey using ZebPay.