

The Cup and Handle indicator is a technical pattern often seen on cryptocurrency price charts. This pattern indicates a correction of a previous uptrend, followed by its continuation. It offers clearly defined entry and risk levels, though interpreting it can be challenging due to the dispersed volume metrics in crypto markets.
In this blog, we will look at this pattern in detail and explain why it has value and how it relates to creating a strategic trading plan that can fully utilize the opportunity. We’ll dig into the specifics of the indicator and explain some of its limitations.
What is a Cup and Handle Chart Pattern?
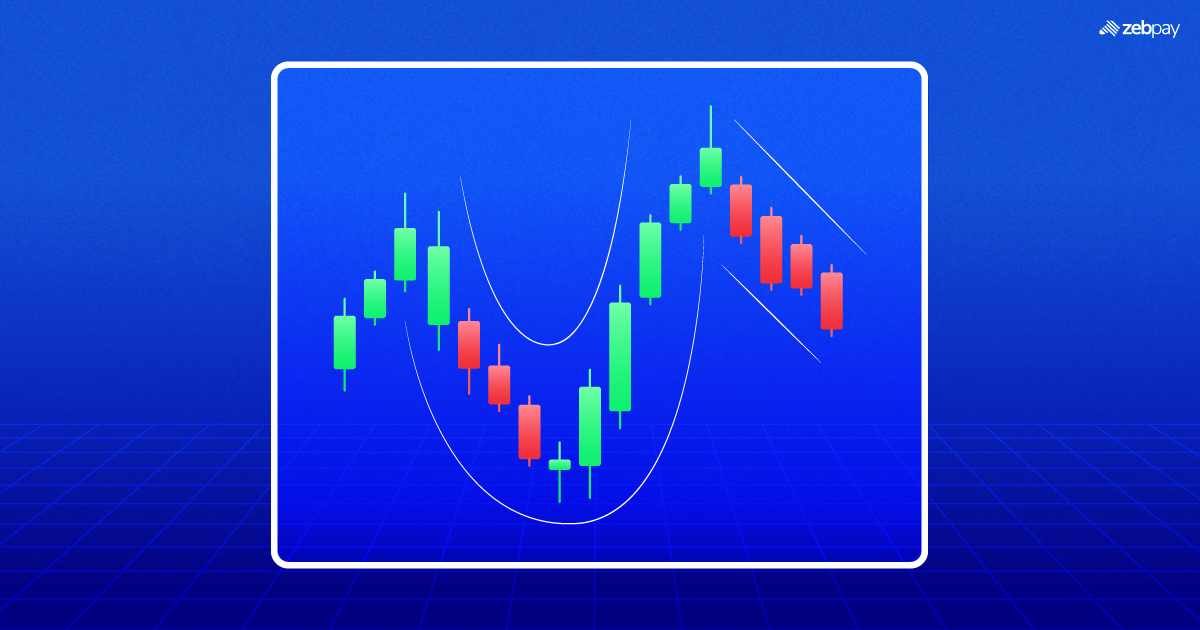
Many technical chart patterns point to expected future movements in price. A good example is the Cup and Handle pattern, which gets its name because it looks like a teacup. It’s one of many signals often used as bullish continuation points to identify promising buying opportunities.
But there are a few restrictions on the cup and handle. The first is that there’s no real timeframe for a cup and handle; the pattern can take a few days to form, or it can take up to a year. There are false signals, but the longer the bottom, and the more round it is, the truer the signal. The cup should not be V-shaped and shouldn’t be too deep. Illiquidity can also stop the pattern from coming into formation, i.e. the more people trading a particular asset, the greater the effect this has on the asset’s price.
Identifying the Components for the Cup and Handle Pattern
The Cup Formation:
- Uptrend Reversal: The chart is often preceded by a period of sustained decline in the asset price.
- Round Bottom: As the downtrend begins to turn, it carves out an inverted cup.
- Duration: A cup formation can take up to several weeks to several months to form, depending on the length of time on the chart.
- Depth: The depth of the cup usually retraces around 30% to 50% of the previous downtrend but can vary.
The Handle Formation:
- Consolidation: Following the cup formation, there is a temporary consolidation or retracement in the price, creating a smaller downward-sloping channel or a sideways movement.
- Duration: The handle formation typically lasts for a shorter duration compared to the cup formation, often lasting several weeks.
By understanding these components, traders can better identify and utilize the cup and handle patterns in their trading strategies.
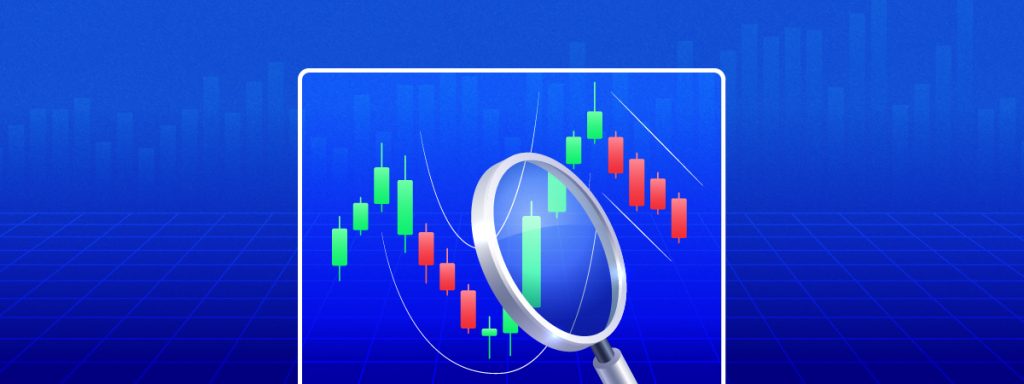
How do I Spot a Cup and Handle Pattern?
To spot the cup and handle pattern, start by discerning the trend. Plot two or more price points on a chart and observe how they move over time.
After establishing the current trend, focus on locating support and resistance levels and monitor breakouts from these areas. Support denotes price points where buyers intervene as prices dip below them, while resistance signifies price points where sellers step in as prices climb above them.
Once these key areas are pinpointed, look into what occurs at these levels by examining previous highs and lows, alongside other technical indicators. This comprehensive approach helps in accurately identifying and understanding market dynamics, which is crucial for recognizing the cup and handle pattern.
Benefits of Using the Cup and Handle Pattern
Using cup and handle patterns offers several advantages:
- Volume Confirmation: The pattern typically begins with high volume during the cup formation, decreases during the handle formation, and then increases again during the breakout. This volume change can confirm the validity of the pattern.
- Long-Term Trend Indication: The cup and handle pattern is an indicator that a bullish trend will likely continue. Furthermore, it becomes more reliable when it forms during an uptrend, indicating that there’s a good chance the current trend will continue and be sustained positively in the long term.
- Ease of Identification: The cup and handle pattern are visually straightforward, resembling a teacup with a handle on the right side. This simplicity makes it one of the easier patterns to identify on a chart.
- Risk Management: The pattern lends itself extremely well to risk management, giving traders clear guidelines of where to place a stop-loss (below the lowest point of the handle) and where to take profit (measuring the depth of the cup from the breakout point).
These benefits are the reason why the cup and handle pattern can be a fantastic tool for crypto traders who wish to put more effort into their analysis and strengthen their risk management regimes.
Read more: What is a Candlestick Pattern
Common Pitfalls and Challenges for Cup and Handle Chart Pattern
There are certain difficulties using the cup and handling patterns in trading.
Application to Small Crypto: Another weakness of the cup and handle method is that it is ineffective on small crypto tokens. These are something new, with a relatively small group of followers. The pattern works better on cryptos that have a growing group of followers. It represents a tug of war between buyers and sellers more accurately when there is considerable interest in buying or selling.
Volume Importance: A crypto’s overall trading volume helps validate a cup and handle pattern. However, measuring the volume correctly can be difficult, as crypto trading is fragmented across many exchanges.
Time-Demanding Disposition: There’s also time for the pattern to finish. Cup-and-handle patterns can take weeks, months, or years to complete, which is the time many traders aren’t willing to spend waiting for the pattern to finish.
How traders address these issues will depend on the circumstances, so there’s no one-size-fits-all approach when using the cup and handle pattern.
Read more: How to Draw Head and Shoulders Patterns
Conclusion
In summary, the Cup and Handle chart pattern is valuable for crypto traders seeking to spot potential bullish continuation trends. Identifying this pattern enables traders to seize opportunities to enter or bolster their long positions, anticipating a price surge upon pattern completion. Implementing effective risk management strategies is essential when trading this pattern, helping to mitigate losses in scenarios involving false breakouts or sudden reversals.
If you found this blog useful, share it with other like-minded crypto enthusiasts. Click on the button below to begin your crypto trading journey using ZebPay.